Endpoint Analysis - WordPress
In endpoint security, analyzing log files is a crucial step in understanding activities and potential threats on individual devices. Endpoint analysis involves examining system logs to detect unauthorized access, abnormal behavior, or malware infections. By leveraging the command shell in Linux, we can efficiently parse, filter, and interpret these logs, gaining insights into security events and system performance. This process helps identify vulnerabilities at the device level and enhances overall network defense.
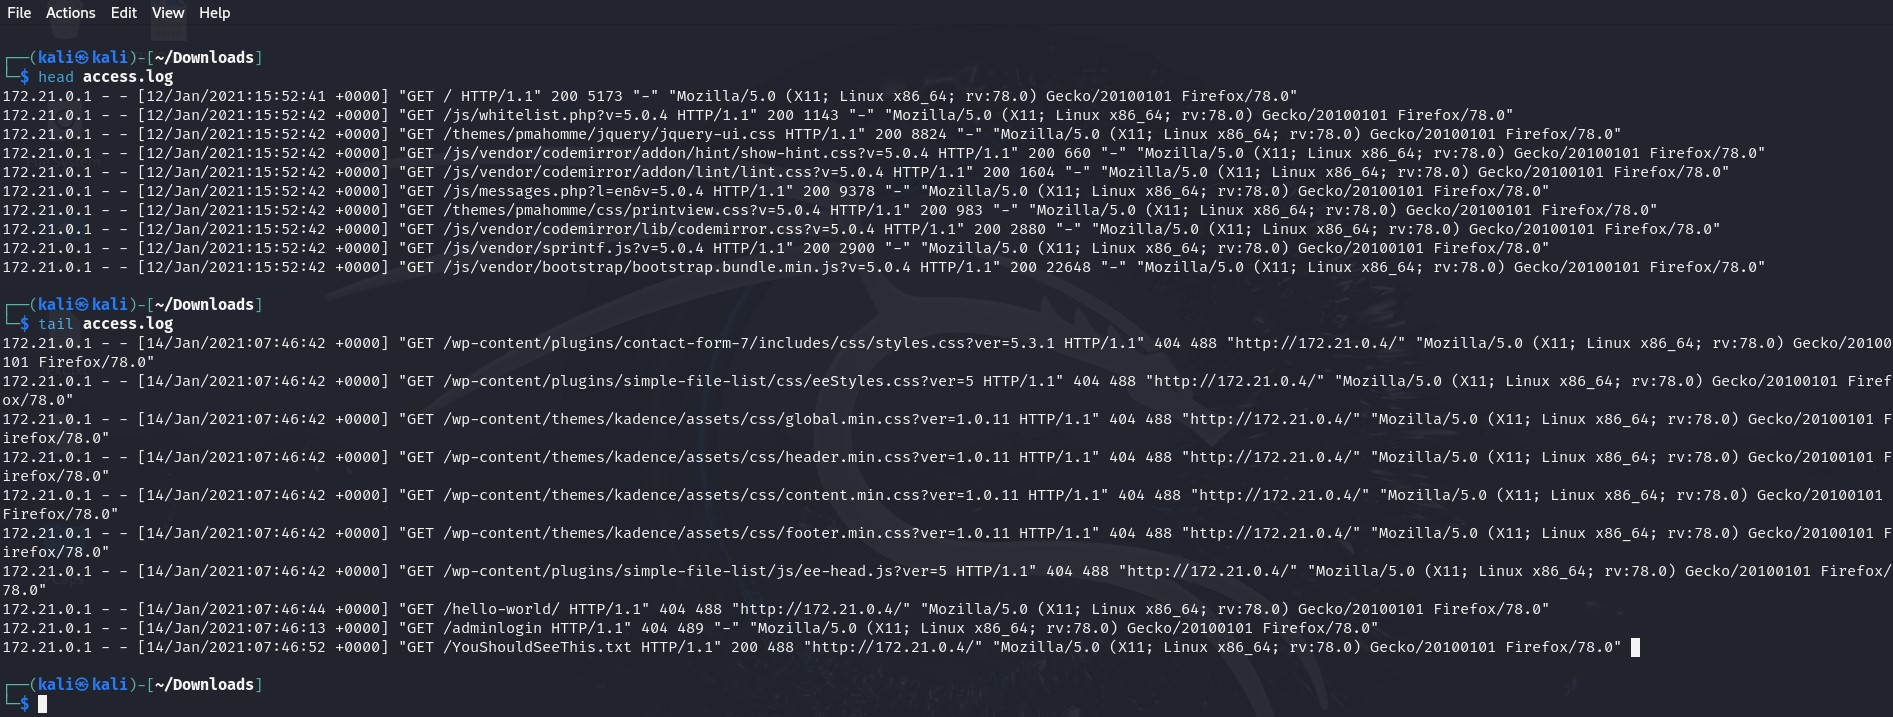
When I begin analyzing log files, I like to use the head and tail commands to get a quick snapshot of the data. head shows me the first few lines, which often contain important information like timestamps, process IDs, or headers, while tail reveals the last few entries, giving me an idea of the most recent activity. This approach helps me quickly understand the structure of the log and spot any immediate issues without having to scroll through the entire file. It’s a simple but effective way to start the investigation.
Viewing the beginning and end of a log file – click image to expand
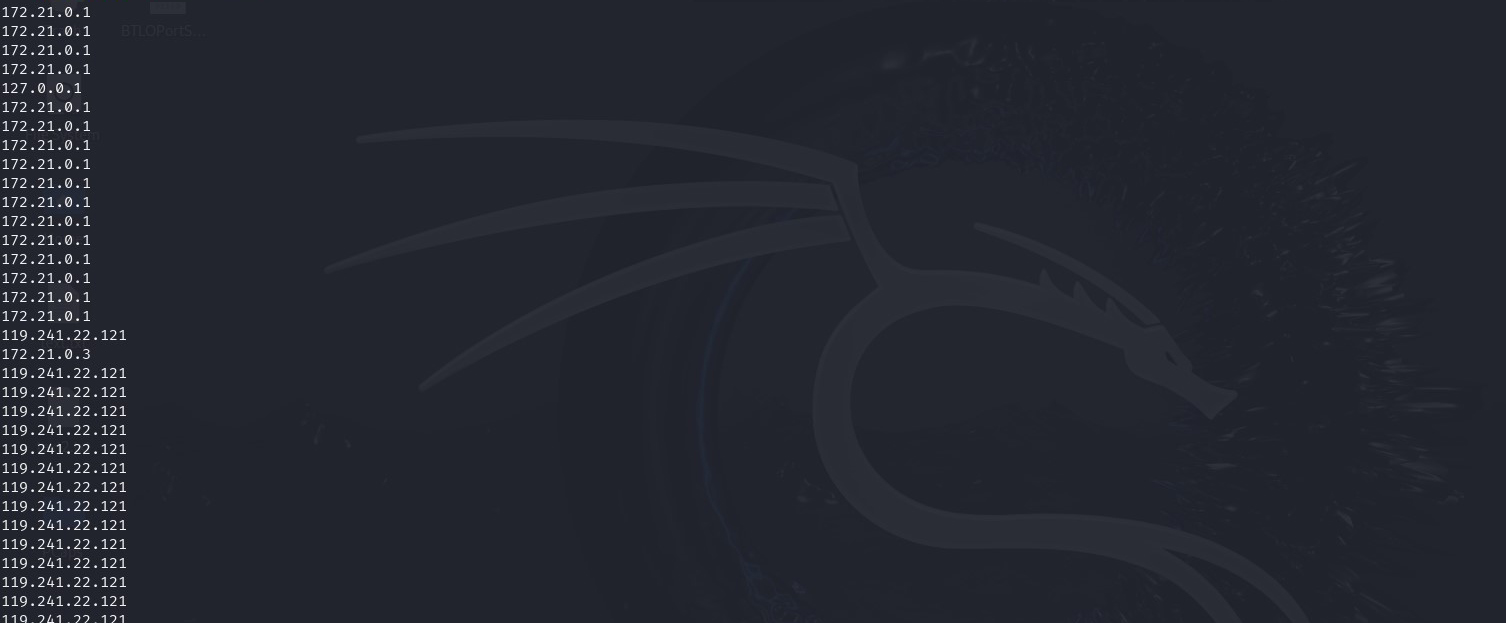
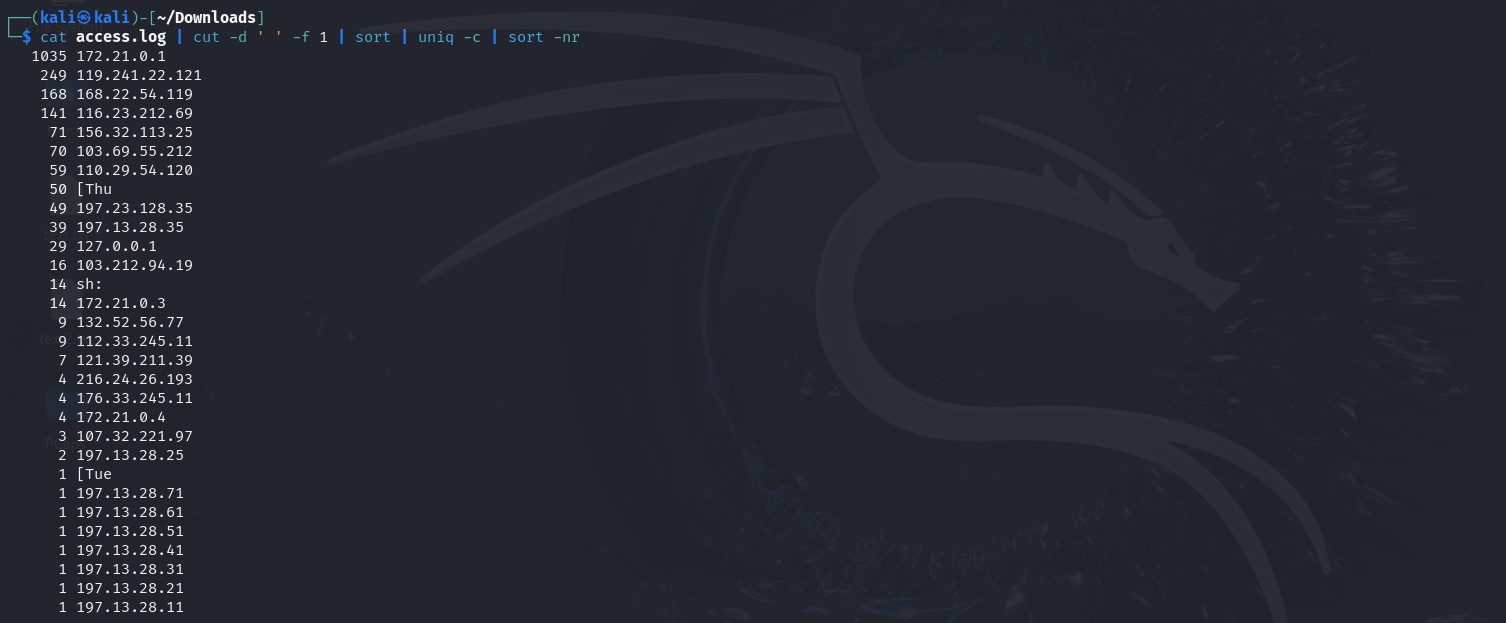
From the log data, we observe that it spans just over two days and the only IP address captured so far is 172.21.0.1. However, to confirm whether there are any other IP addresses present in the log, we can use the following command: cat access.log | cut -d ‘ ‘ -f 1. This command works by first using cat to display the contents of the access.log file. Then, cut is used to extract specific fields from each line of the log. The -d ‘ ‘ option tells cut to use a space as the delimiter, and -f 1 instructs it to extract the first field. This approach allows us to quickly isolate and review all IP addresses recorded in the log for any anomalies or addresses that may have gone unnoticed. I then sort the data. I then refine my search by piping the output through the following commands: | sort | uniq -c | sort -nr. This helps me to analyze the data more efficiently. sort arranges the IP addresses alphabetically, allowing any duplicate entries to be grouped. uniq -c counts how many times each unique IP address appears in the log. Finally, sort -nr reorders the list numerically in descending order based on the frequency of each IP address. This method highlights the most active IP addresses at the top, making it easier to spot suspicious or unusual traffic patterns. By focusing on frequency, I can quickly assess whether any specific IPs have generated a significant amount of activity that might require further investigation.
Filtering log for other IP addresses – click image to expand
Refining filtered information for patterns and frequency – click image to expand
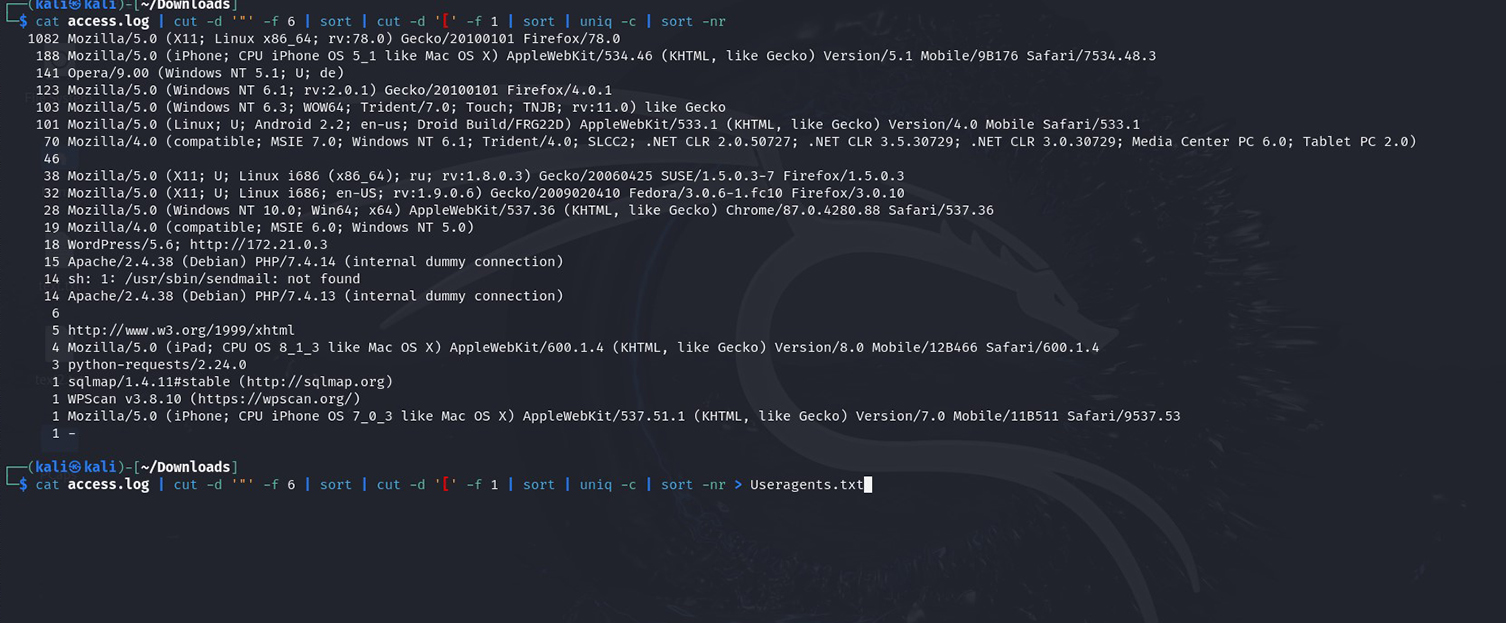
I observed that the IP address 172.21.0.1 appears 1,035 times in the log, I saved this information into a .txt file for future reference. Although the frequent occurrence of this IP doesn’t immediately signal malicious activity, keeping a record of it is useful for future cross-referencing. The next step I took was to examine the User-Agent information, which we observed using the head and tail commands as “Mozilla 5.0.” However, more detailed information might reveal other agents. I accomplished this using the command: cat access.log | cut -d ‘”‘ -f 1. While this doesn’t yield the desired results, I continue experimenting with different field parameters. I switch to -f 2, it reveals that the log entries are from a WordPress website. Then, using -f 3, I discovered HTTP status codes for different sessions indicating different connection outcomes. After a few tries, I extracted the desired field using: cat access.log | cut -d ‘”‘ -f 6 | sort | cut -d ‘[‘ -f 1 | sort | uniq -c | sort -nr. This command chain isolates the User-Agent strings, sorts them, and counts how often each appears. I then save the results to a file for future reference.
Filtring log to get more information – click image to expand
Exporting user agent information from log – click image to expand
After filtering user agents, I observed unusually high traffic from Mozilla/Linux (1,082 hits) and iPhone devices (188 hits), which may indicate user-agent spoofing. This platform diversity raises suspicion, as attackers often mask their activity by spoofing user agents.
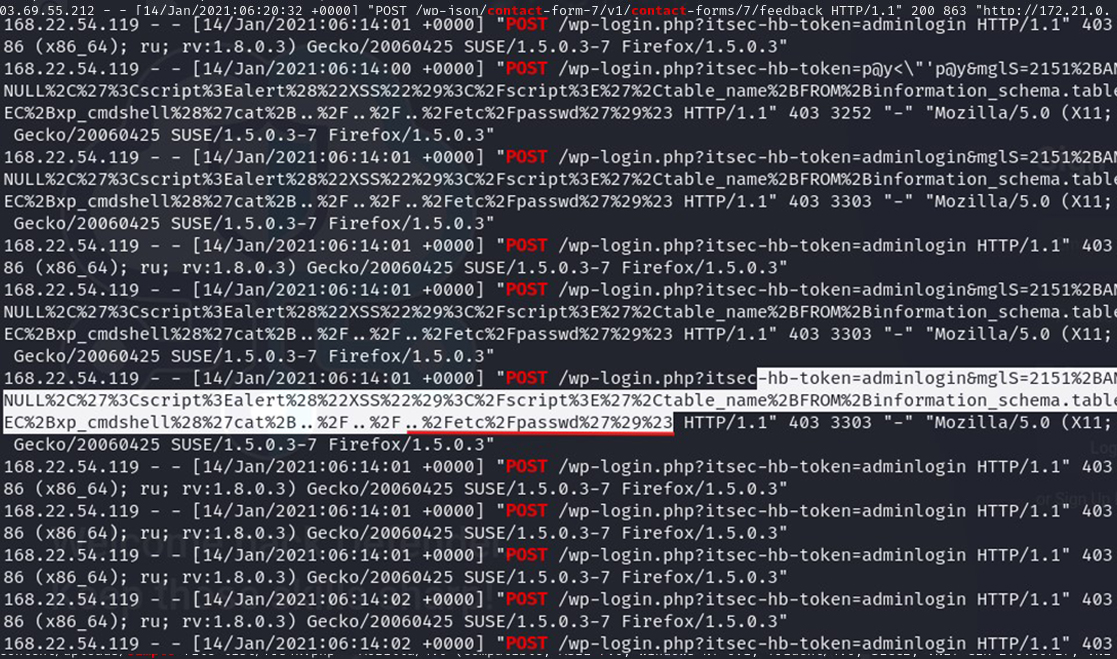
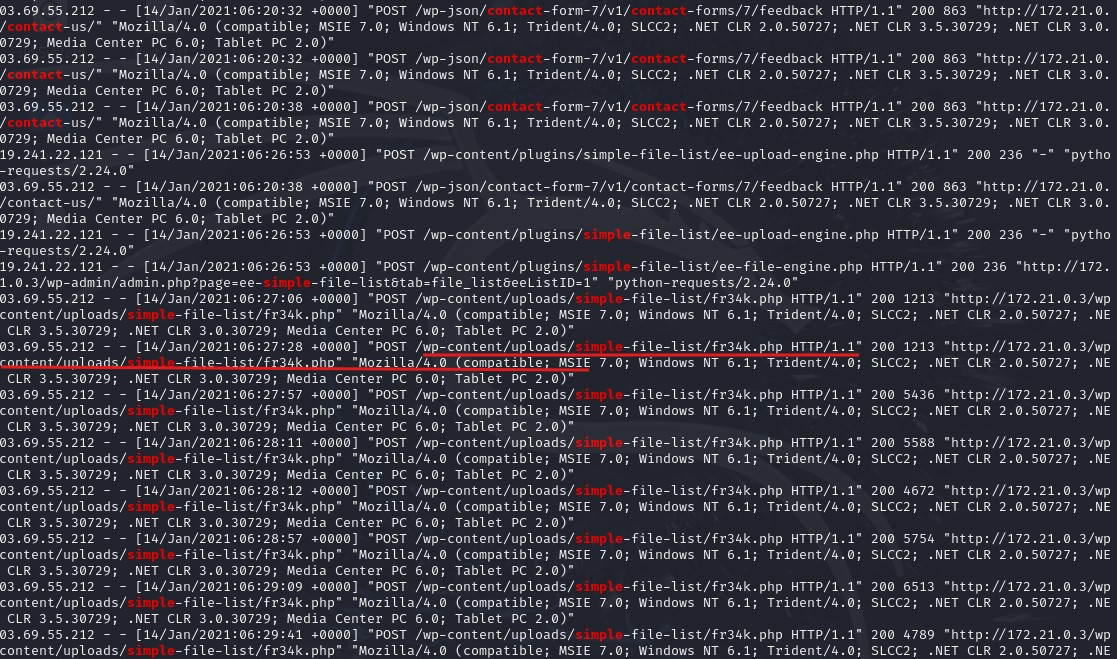
To investigate further, I focused on POST requests with grep ‘POST’ access.log. This revealed attempts to access sensitive files like /etc/passwd, a frequent target for credential theft. Many of these requests returned 403 Forbidden errors, so I refined the search with: grep ‘POST’ access.log | grep -1 ‘contact’ && grep ‘POST’ access.log | grep -1 ‘simple’. This helped filter out blocked requests, revealing that no uploads occurred via the contact plugin. However, an upload did exploit the simple-file-list plugin vulnerability using a Python request with a user-agent originating from IP 119.241.22.121, associated with the iPhone device. The activity suggests the phone may be compromised and involved in crawling, given the volume of GET requests.
Attempt to Exfiltrate passwords – click image to expand
Exploiting vulnerability in plugin – click image to expand
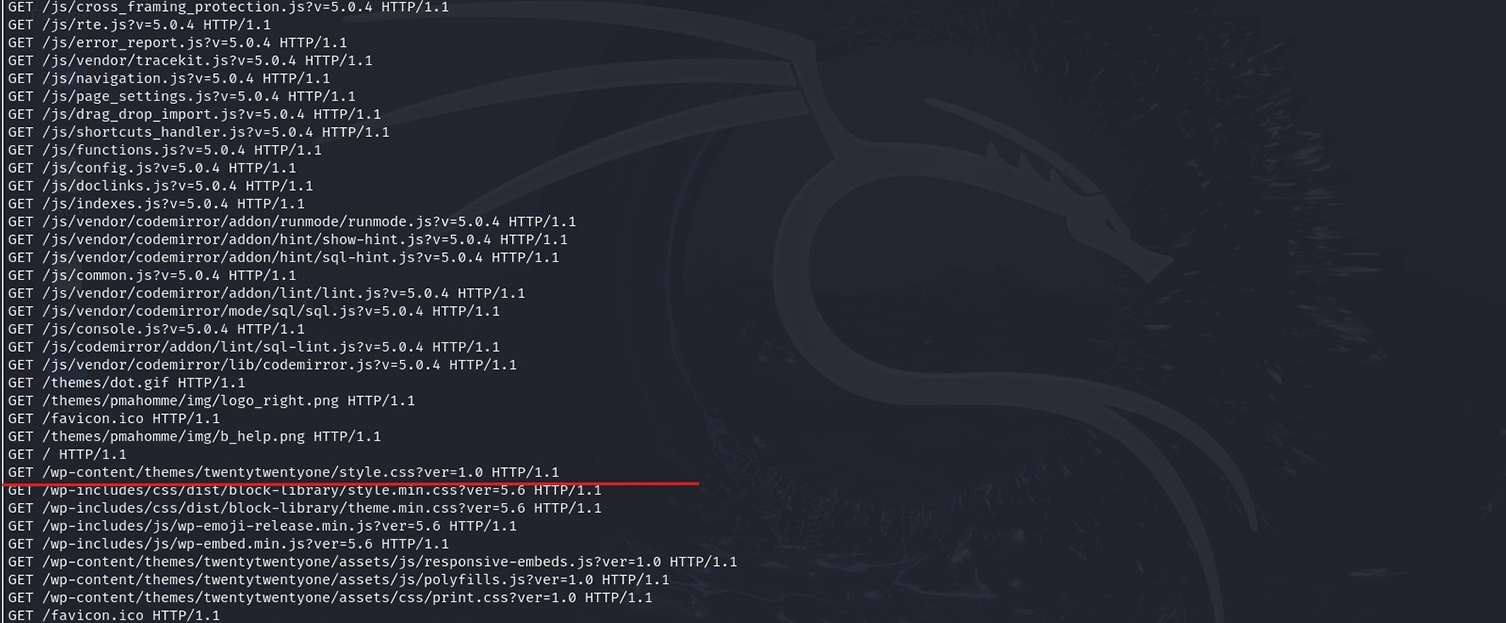
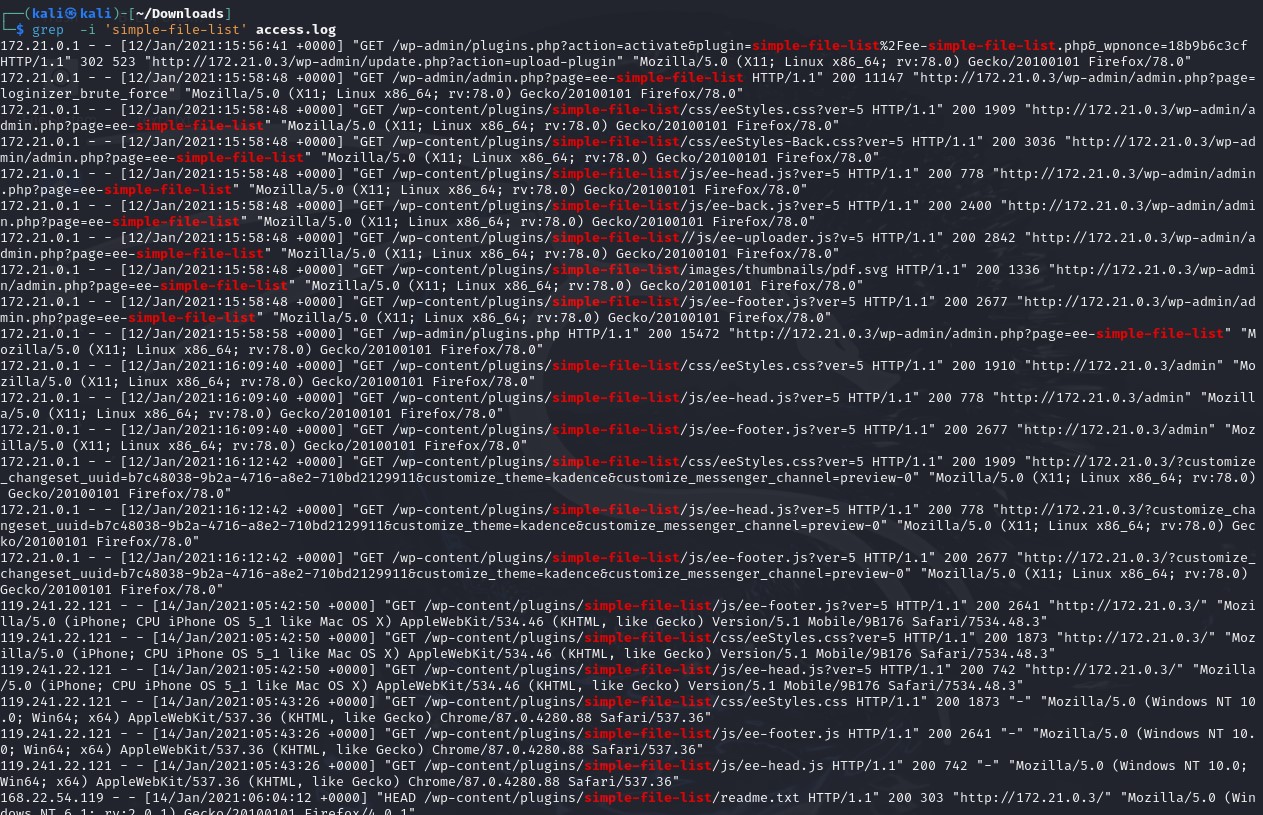
After identifying the exploited vulnerability, I reviewed all plugin-related activities to determine when the exploit began. The plugin was activated on January 12 at 15:57:07. The first notable interaction occurred on January 14 at 05:42:34, involving both the contact form and simple-file-list plugins. Shortly after, a POST request for an admin login token was logged at 05:54:14, followed by a user-agent WPScan request from IP 119.241.22.121 (traced to Japan) crawling paths on 172.21.0.3.
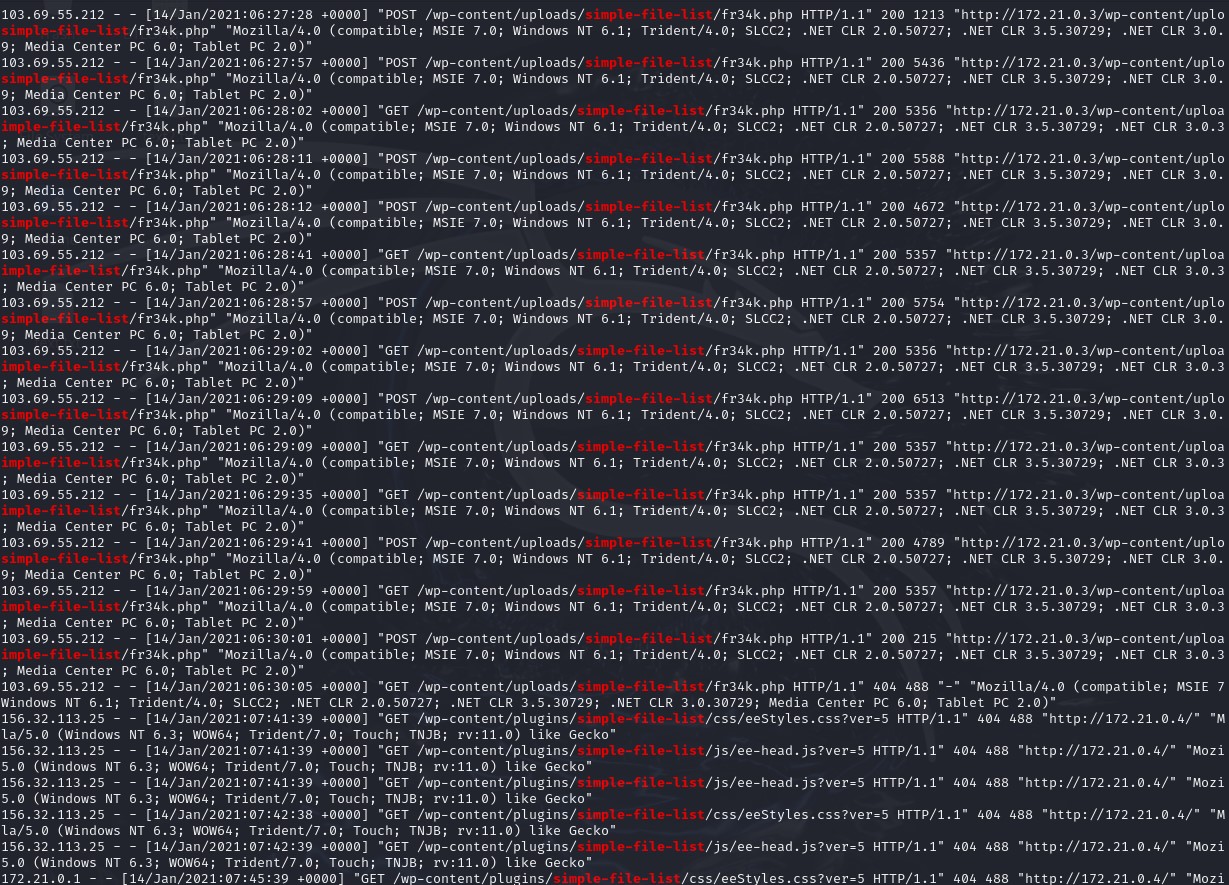
Following this, a POST request to simple-file-list led to the upload of fr34k.php (renamed with a .png extension to evade detection), a common evasion tactic in exploits. Subsequently, IP 103.69.55.212 (traced to Taiwan) accessed the plugins and made a GET request for fr34k.php. The final activity from 119.241.22.121 was on January 26 at 06:26:53 UTC, while 103.69.55.212’s last activity was on January 14 at 06:30:11 UTC. The entire exploit spanned 47 minutes and 37 seconds.
Exploiting vulnerability in a plugin – click image to expand
Through meticulous analysis of the log file, we uncovered a sophisticated exploitation sequence that demonstrates how vulnerabilities can be leveraged to gain unauthorized access. By identifying unusual patterns in user-agent traffic, systematically refining search parameters, and closely tracking IP addresses, we traced the activity to a coordinated attack involving compromised plugins. This exercise highlights the importance of proactive log monitoring and detailed endpoint analysis to identify and mitigate potential breaches.
In cybersecurity, small details like user-agent anomalies and unexpected IP behaviors are often the first indicators of malicious activity. By following a structured approach to log analysis, we turned raw data into actionable intelligence. This activity underscores the value of strong endpoint monitoring practices, which are essential for staying ahead of evolving threats and protecting critical systems.
